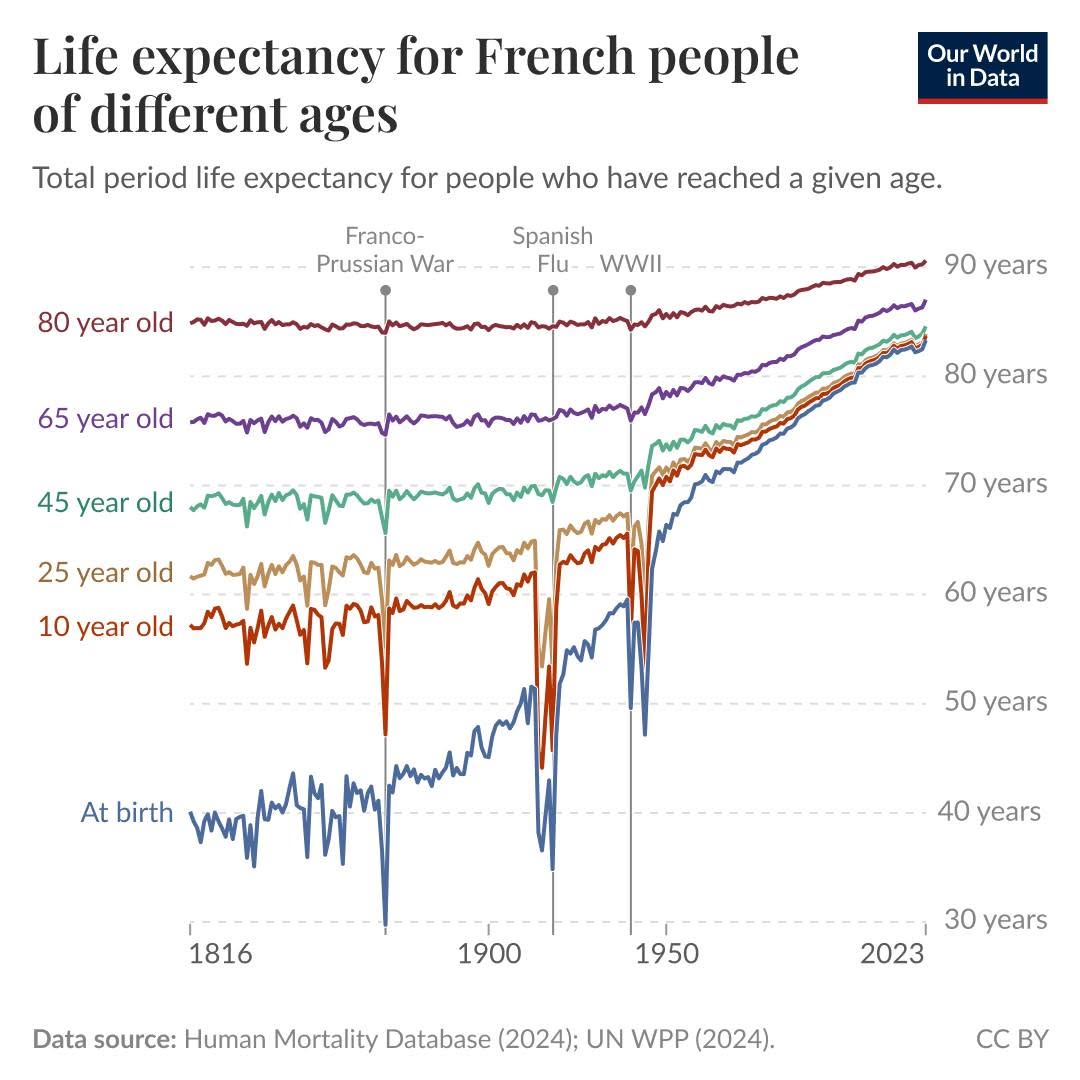
Life expectancy has risen significantly at every age, since 1950.
For example:
An 80yo today in France has 5 more years of life expectancy than they did in 1950.
A 65yo today in France has almost 10 more years of life expectancy than in 1950.
A 45yo has almost 15 more years of life expectancy.
#lifeexpectancyHD #cvddeathHD
Life expectancy has increased at all ages—
It’s a common misconception that life expectancy has increased only because fewer children die. Historical mortality records show that adults today also live much longer than adults in the past.
It’s true that child mortality rates were much higher in the past, and their decline has greatly improved overall life expectancy. But in recent decades, improvements in survival at older ages have been even more important.
The chart shows the period life expectancy in France for people of different ages. This measures how long someone at each of those ages would live, on average, if they experienced the death rates recorded in that year.
For example, the last point on the top dark-red line shows that an 80-year-old in 2023 could expect to live to about 90, assuming mortality rates stayed as they were in 2023.
As you can see, life expectancy in France has risen at every age. In 1816, someone who had reached the age of 10 could expect to live to 57. By 2023, this had increased to 84. For those aged 65, it rose from 76 in 1816, to 87 in 2023.
The data for many other countries shows the same. This remarkable shift is the result of advances in medicine, public health, and living standards.
(This Data Insight was written by Esteban Ortiz-Ospina.)
Explore the data for more countries, and read more about how life expectancy is measured: Life expectancy: what does this actually mean? (Our World in Data, 2017)