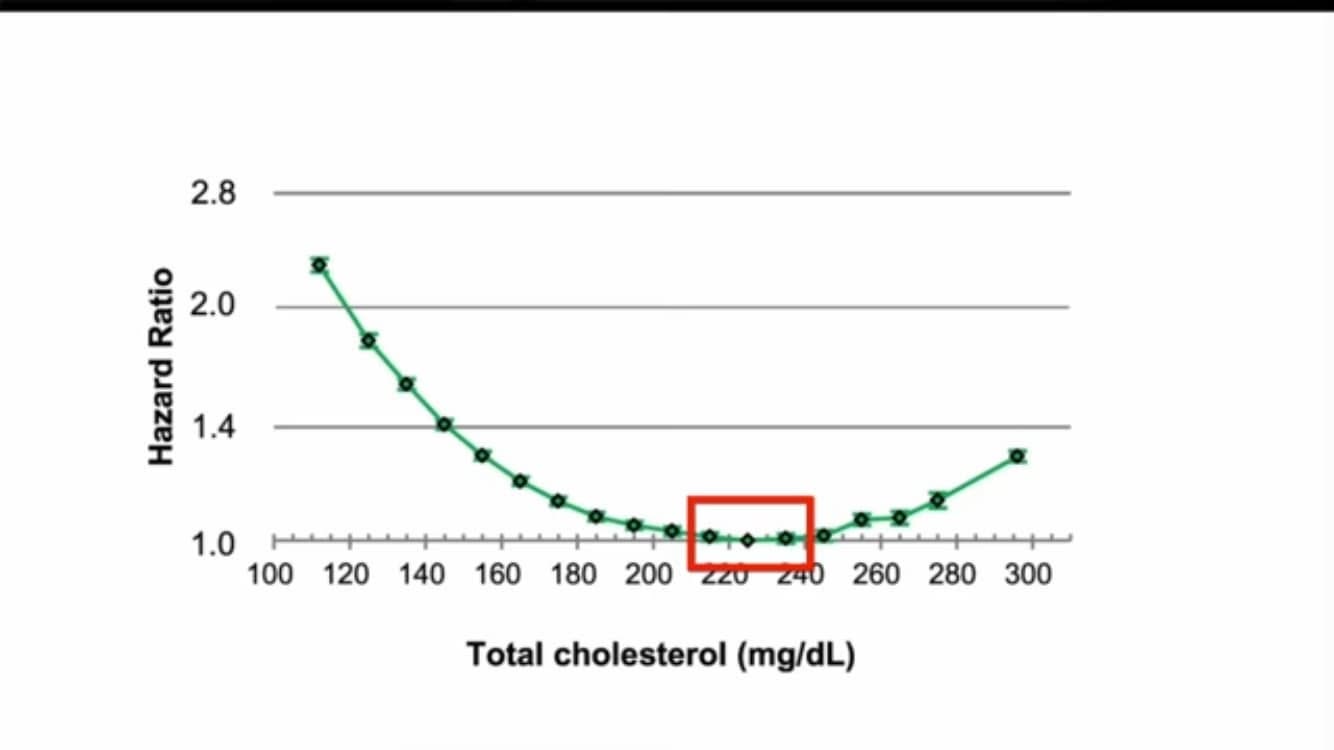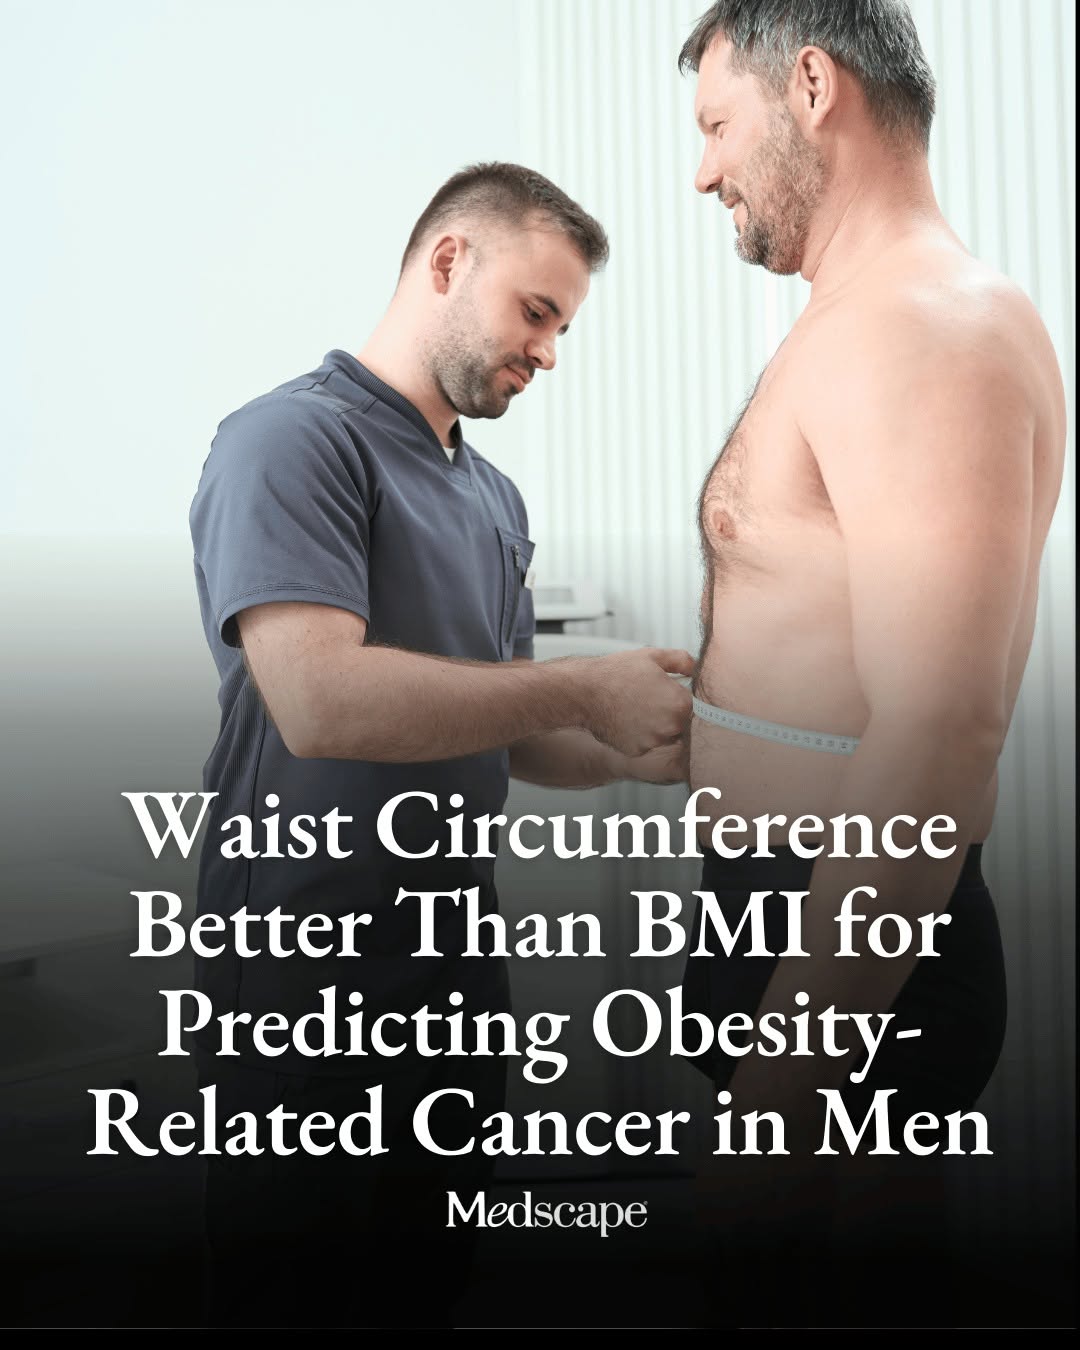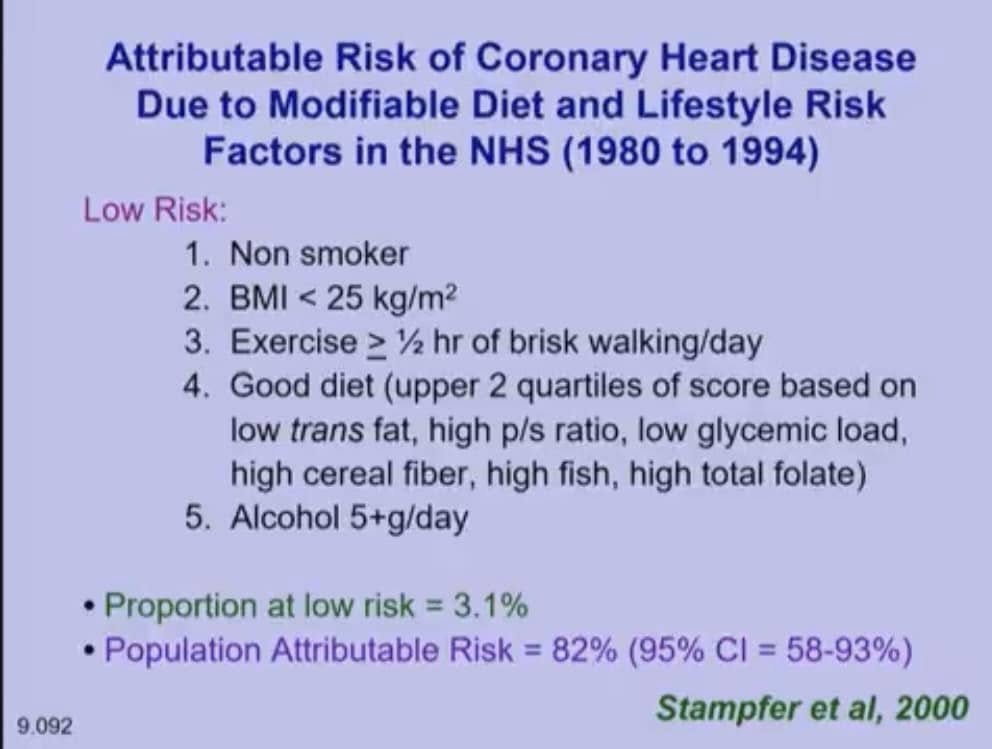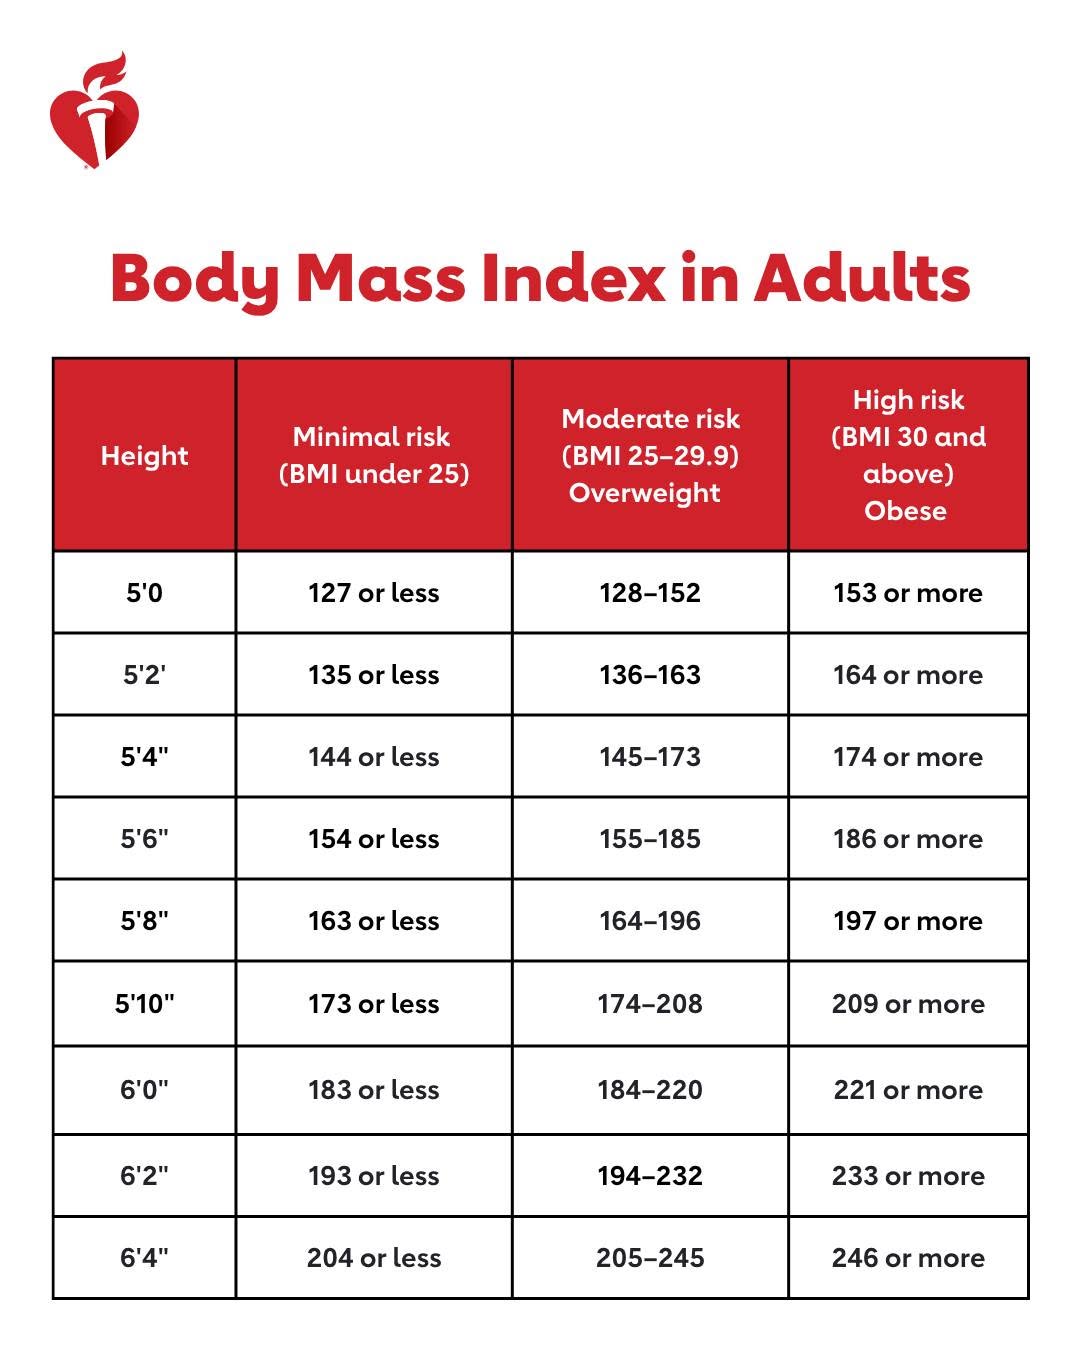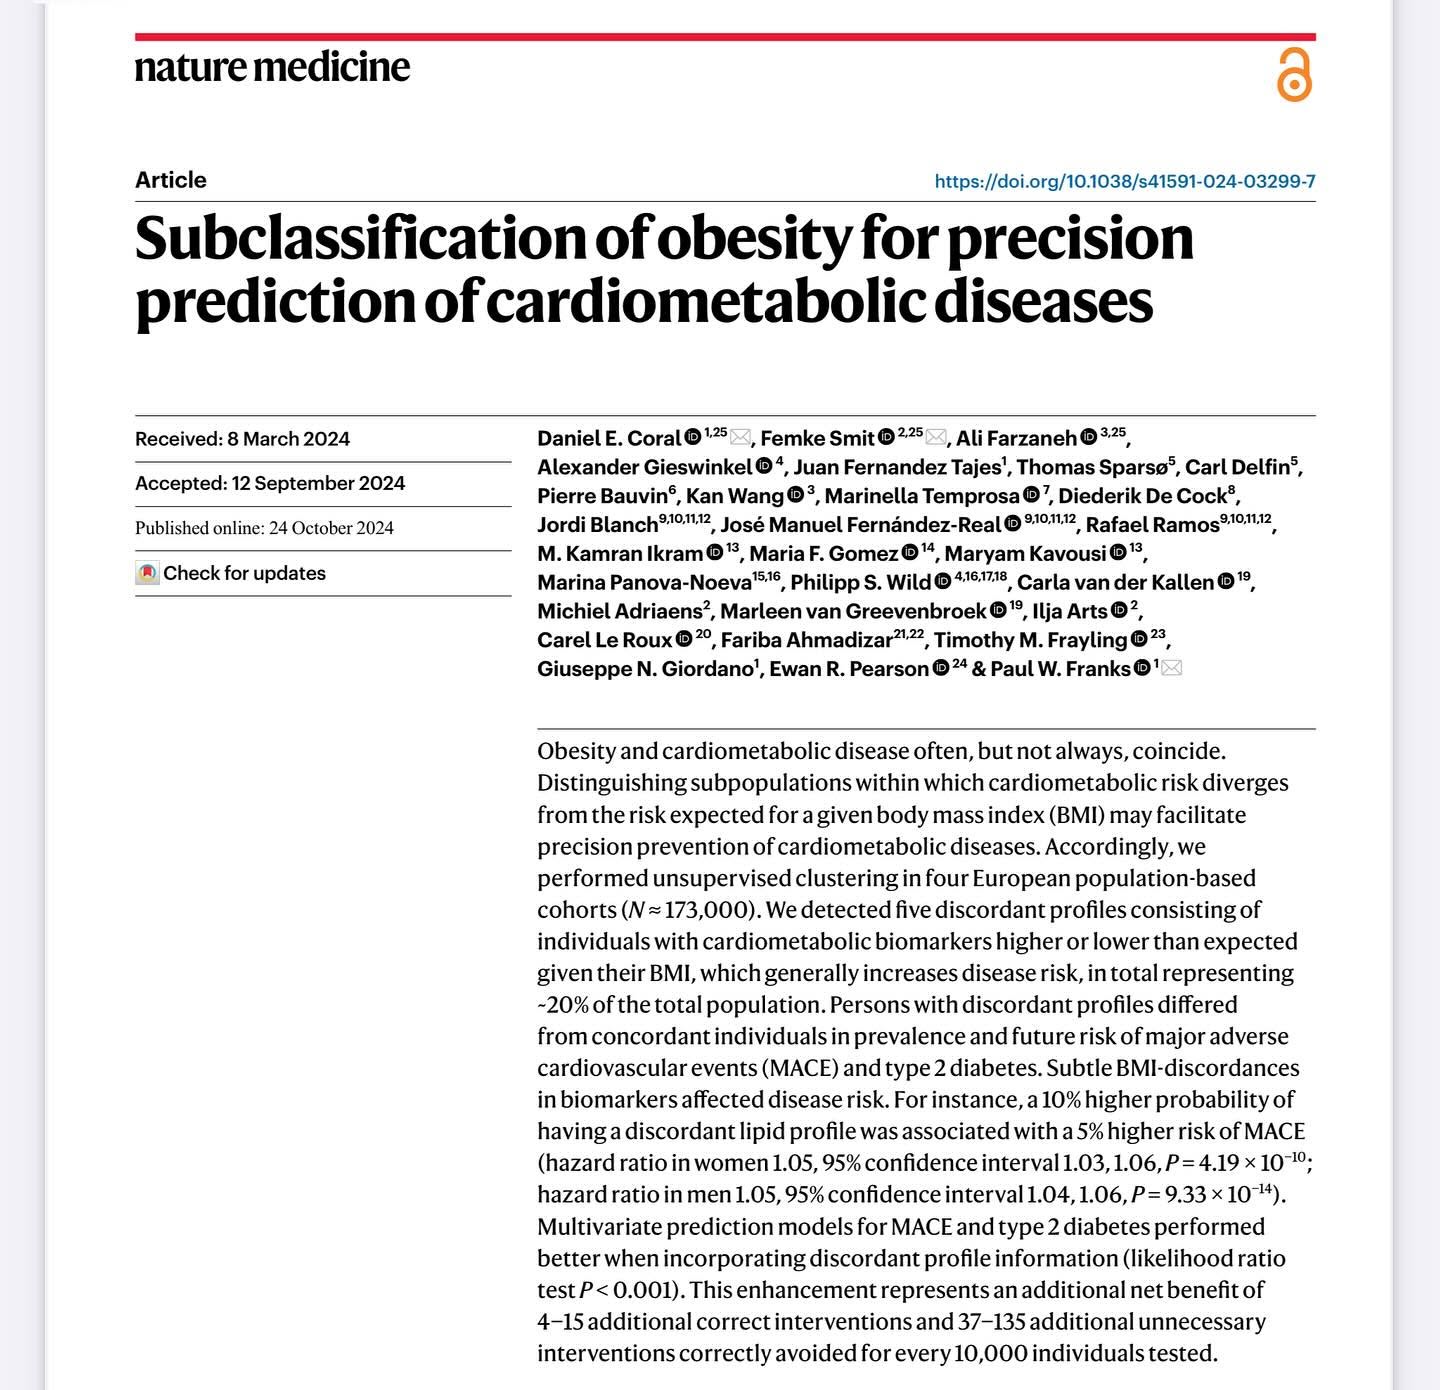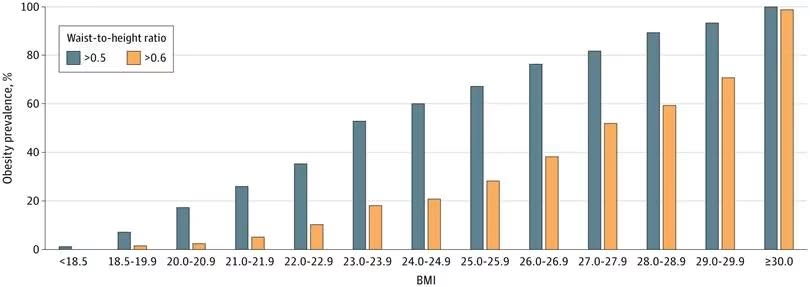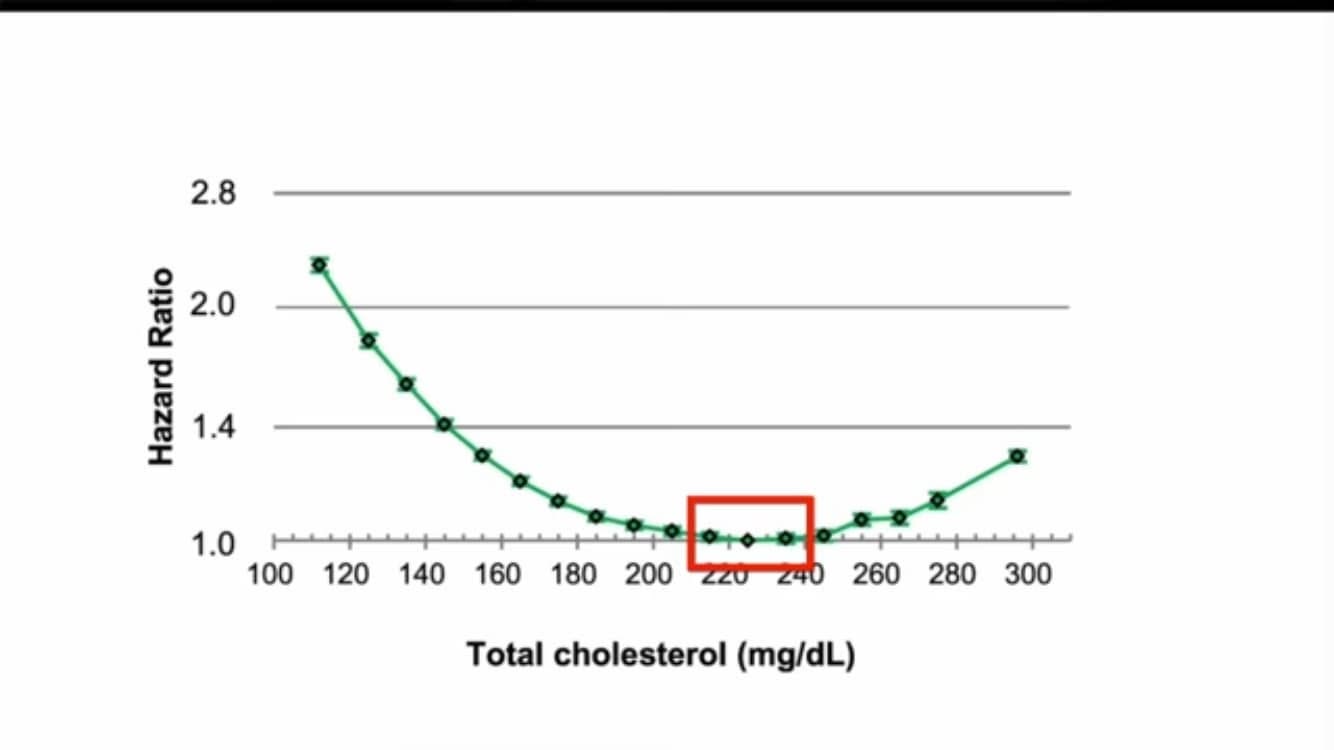
U-shaped mortality curves for cholesterol, BMI, A1C and BP reflect reverse causality
A post explaining that U-shaped hazard curves in observational data appear for cholesterol, BMI, A1C and blood pressure alike, and are explained by reverse causality rather than benefit of high values. Illness lowers LDL, BMI, A1C or blood pressure, creating false appearances of protection.