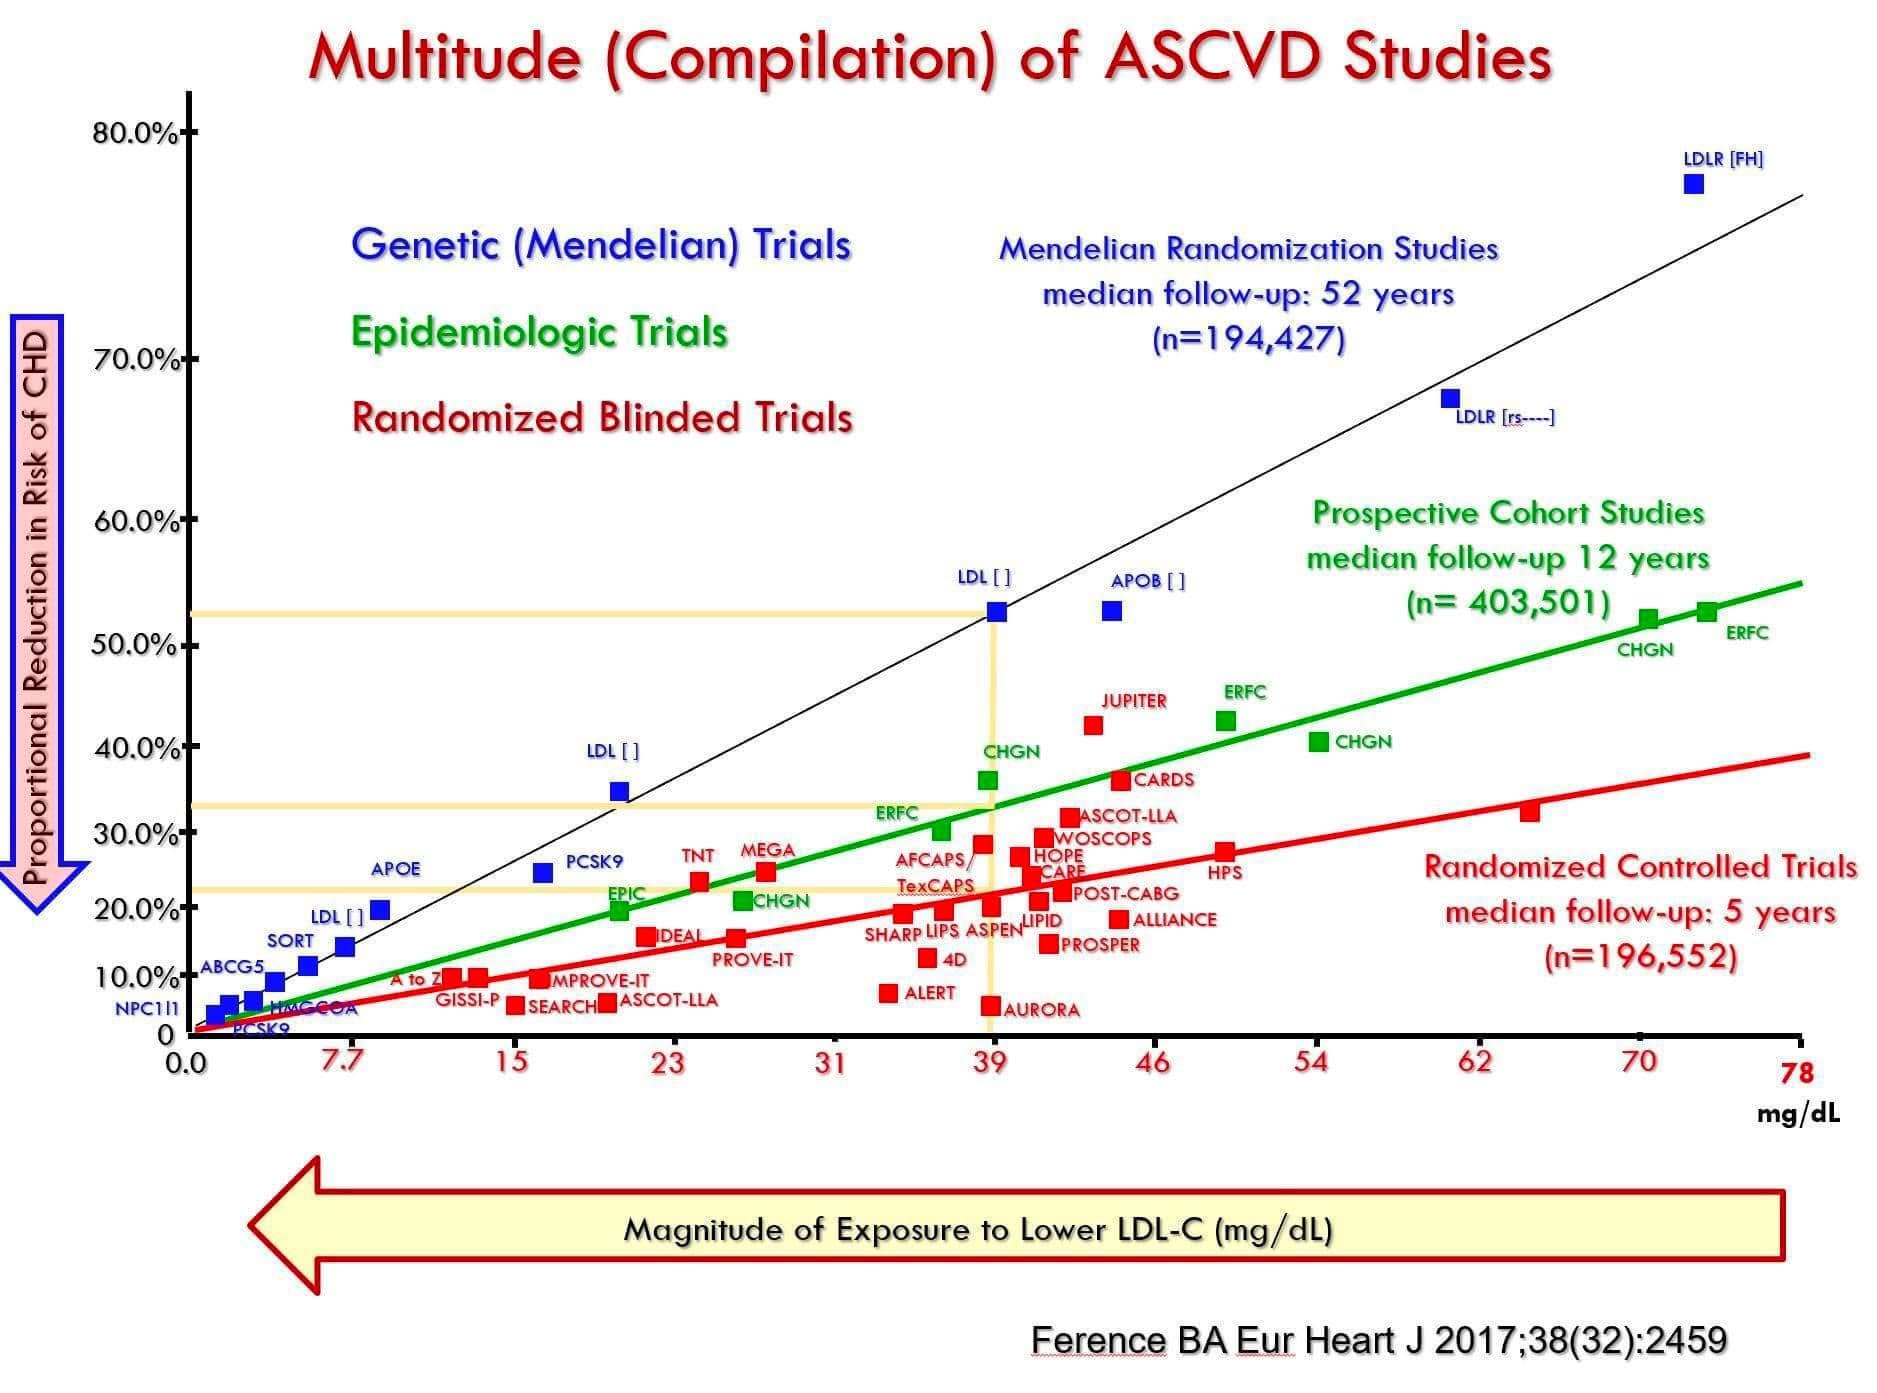
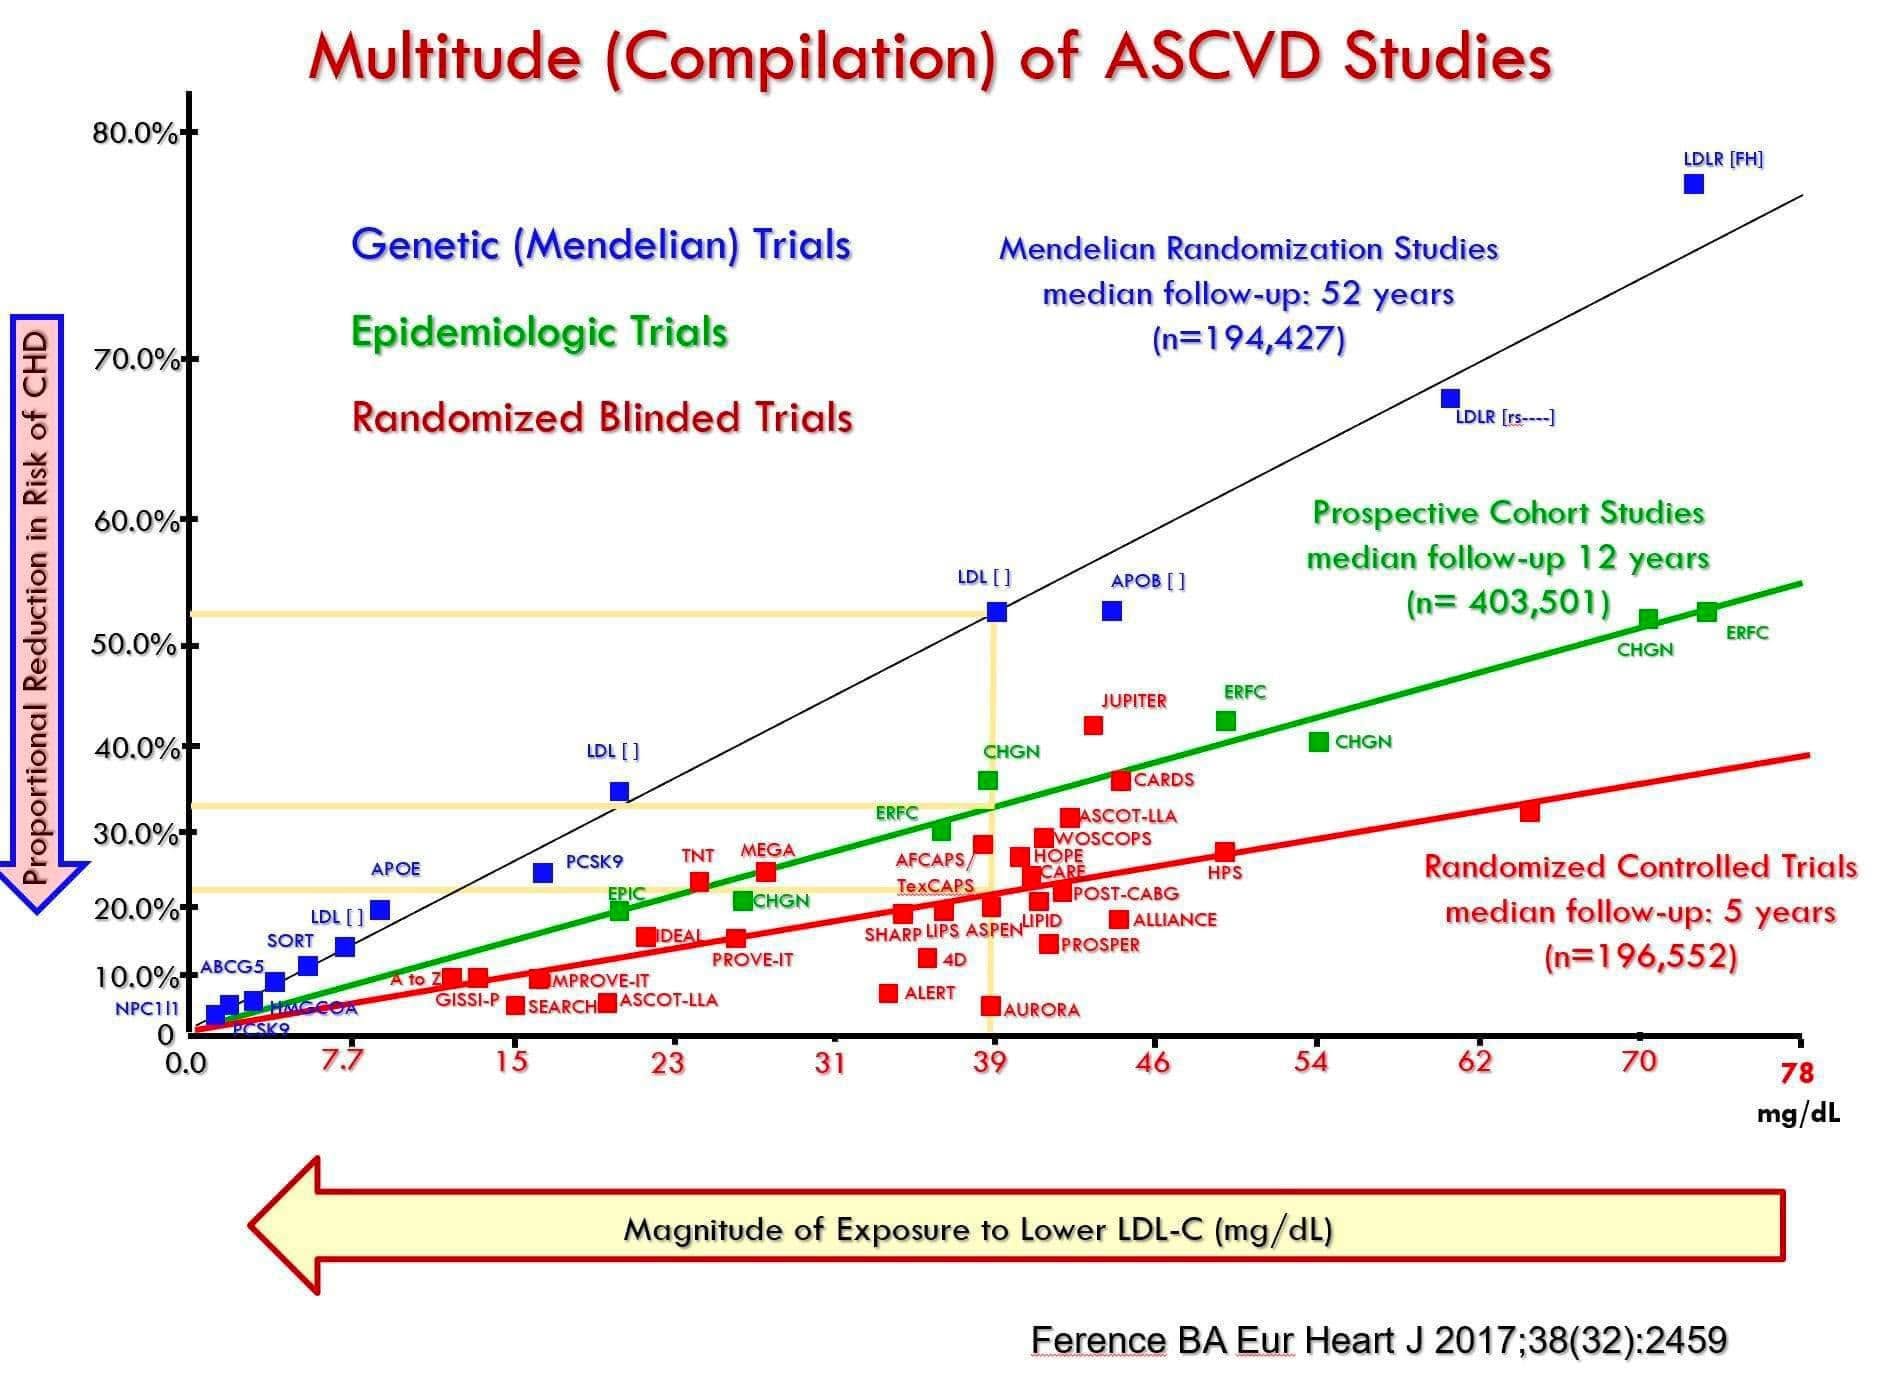
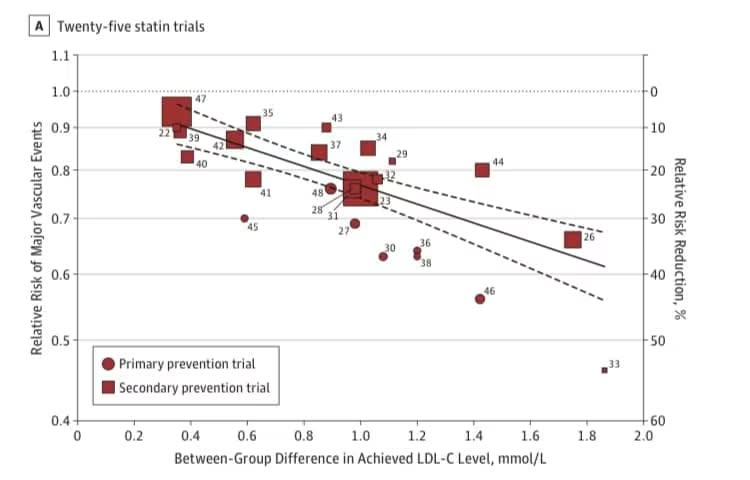
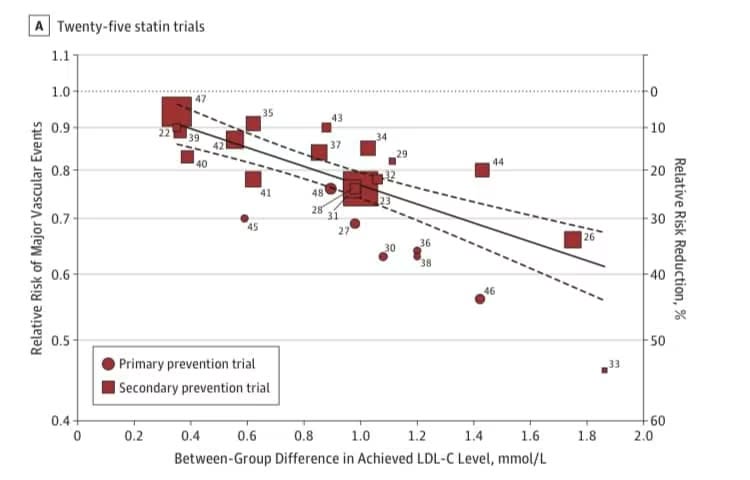
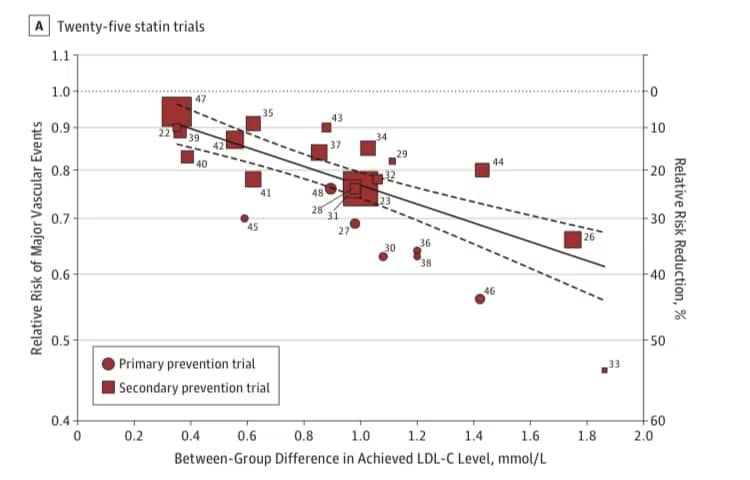
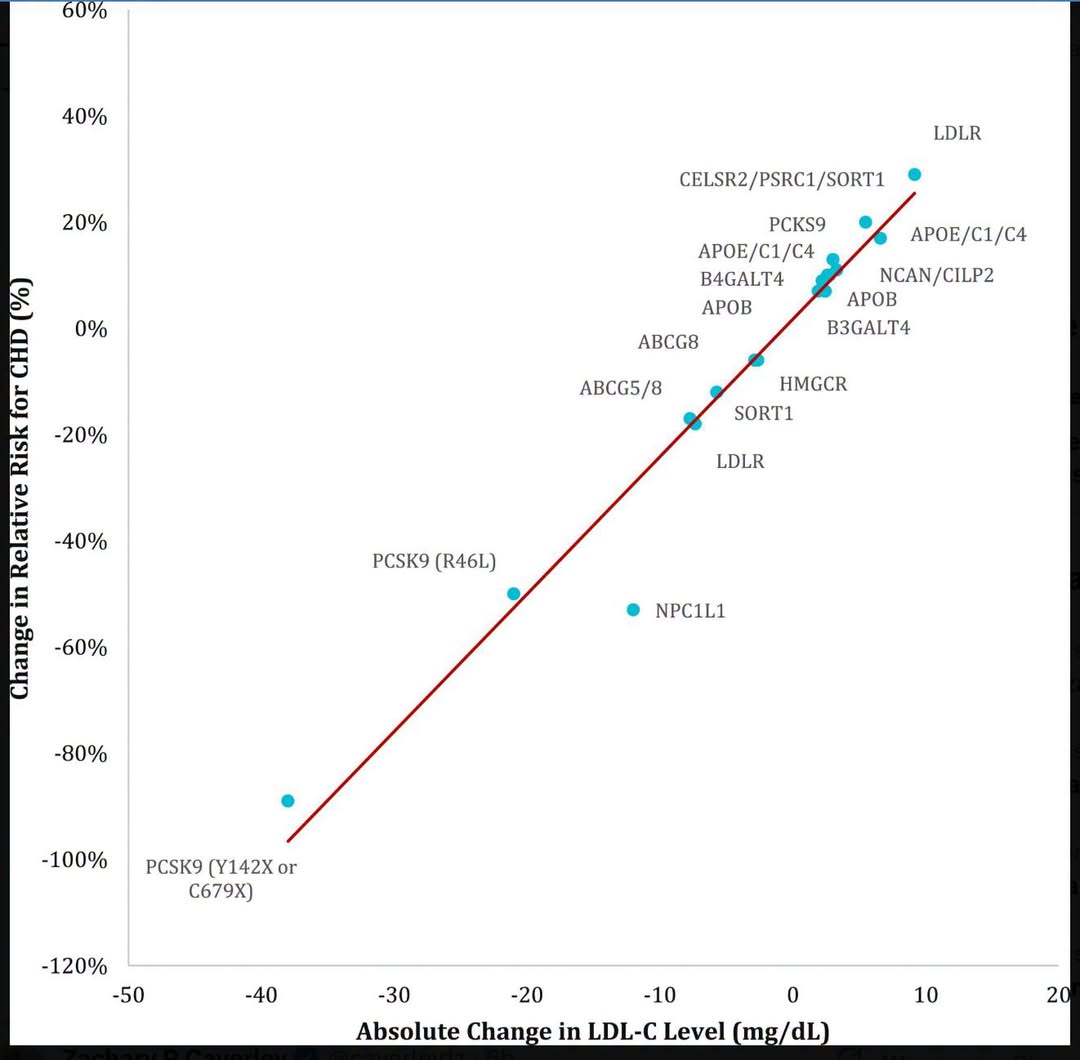
All the very large randomized controlled trials summarized on one graph.
It also includes prospective cohort studies and mendellian randomization (MR) studies.
The RCT’s are the most important because these prove causality.
This chart shows 18 large long-running RCT’s that have each shown that LDL is causal in heart disease. Lowering LDL in each of these 18 trials lowers risk of having a heart attack or stroke. The data is overwhelming.
The problem with the RCT’s is that they only go for about 5 years on average. The prospective cohort studies tell you what happens over 12 years, on average. The MR studies tell you what happens over 52 years, on average.
They all show the same thing: The relationship between LDL and risk of heart attack is literally a straight line. The longer you are exposed to high LDL (5yr, 12yr, 52yr), the higher the slope of that line.
Note that the x-axis represents a change in LDL, not an absolute value of LDL. So the difference between the value of 78mg/dL and 0 mg/dL on the x-axis might correspond to a difference between 178mg/dL and 100mg/dL, for example, or any other combination that represents this difference. The y-axis also represents a percentage change in risk.
#ldlrctsHD #statinrctsHD #ldlHD #statinsHD