This is a possible explanation for why ApoB (LDL) was not associated with plaque progression in the LMHR study (Keto-CTA).
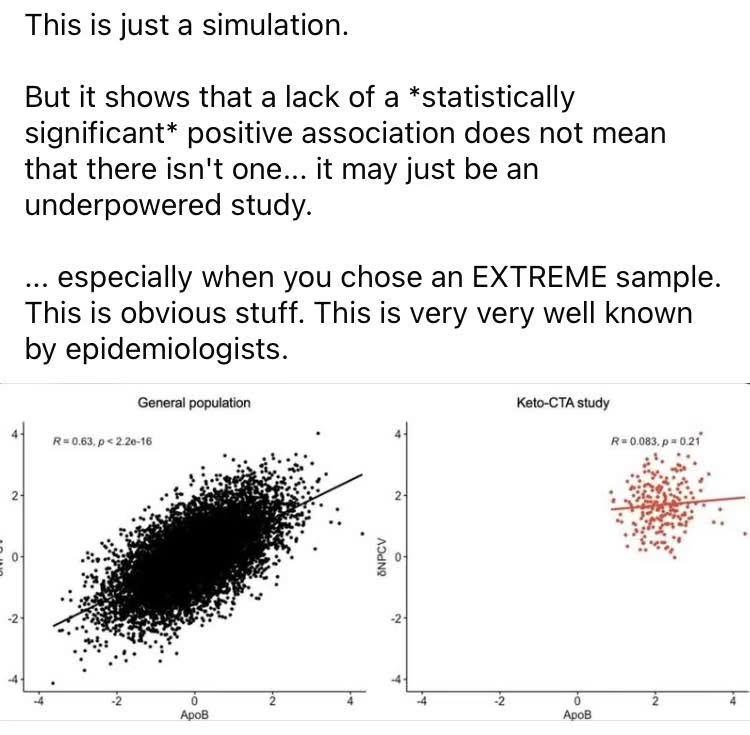
The red plot on the right is obtained by taking a small sampling of extreme points from the black plot on the left.
This sampling makes the association appear to vanish, but this is in fact just an artifact of the small sample size and the extreme location from which it is taken.
Reference:
This was posted in the LMHR group on Facebook.