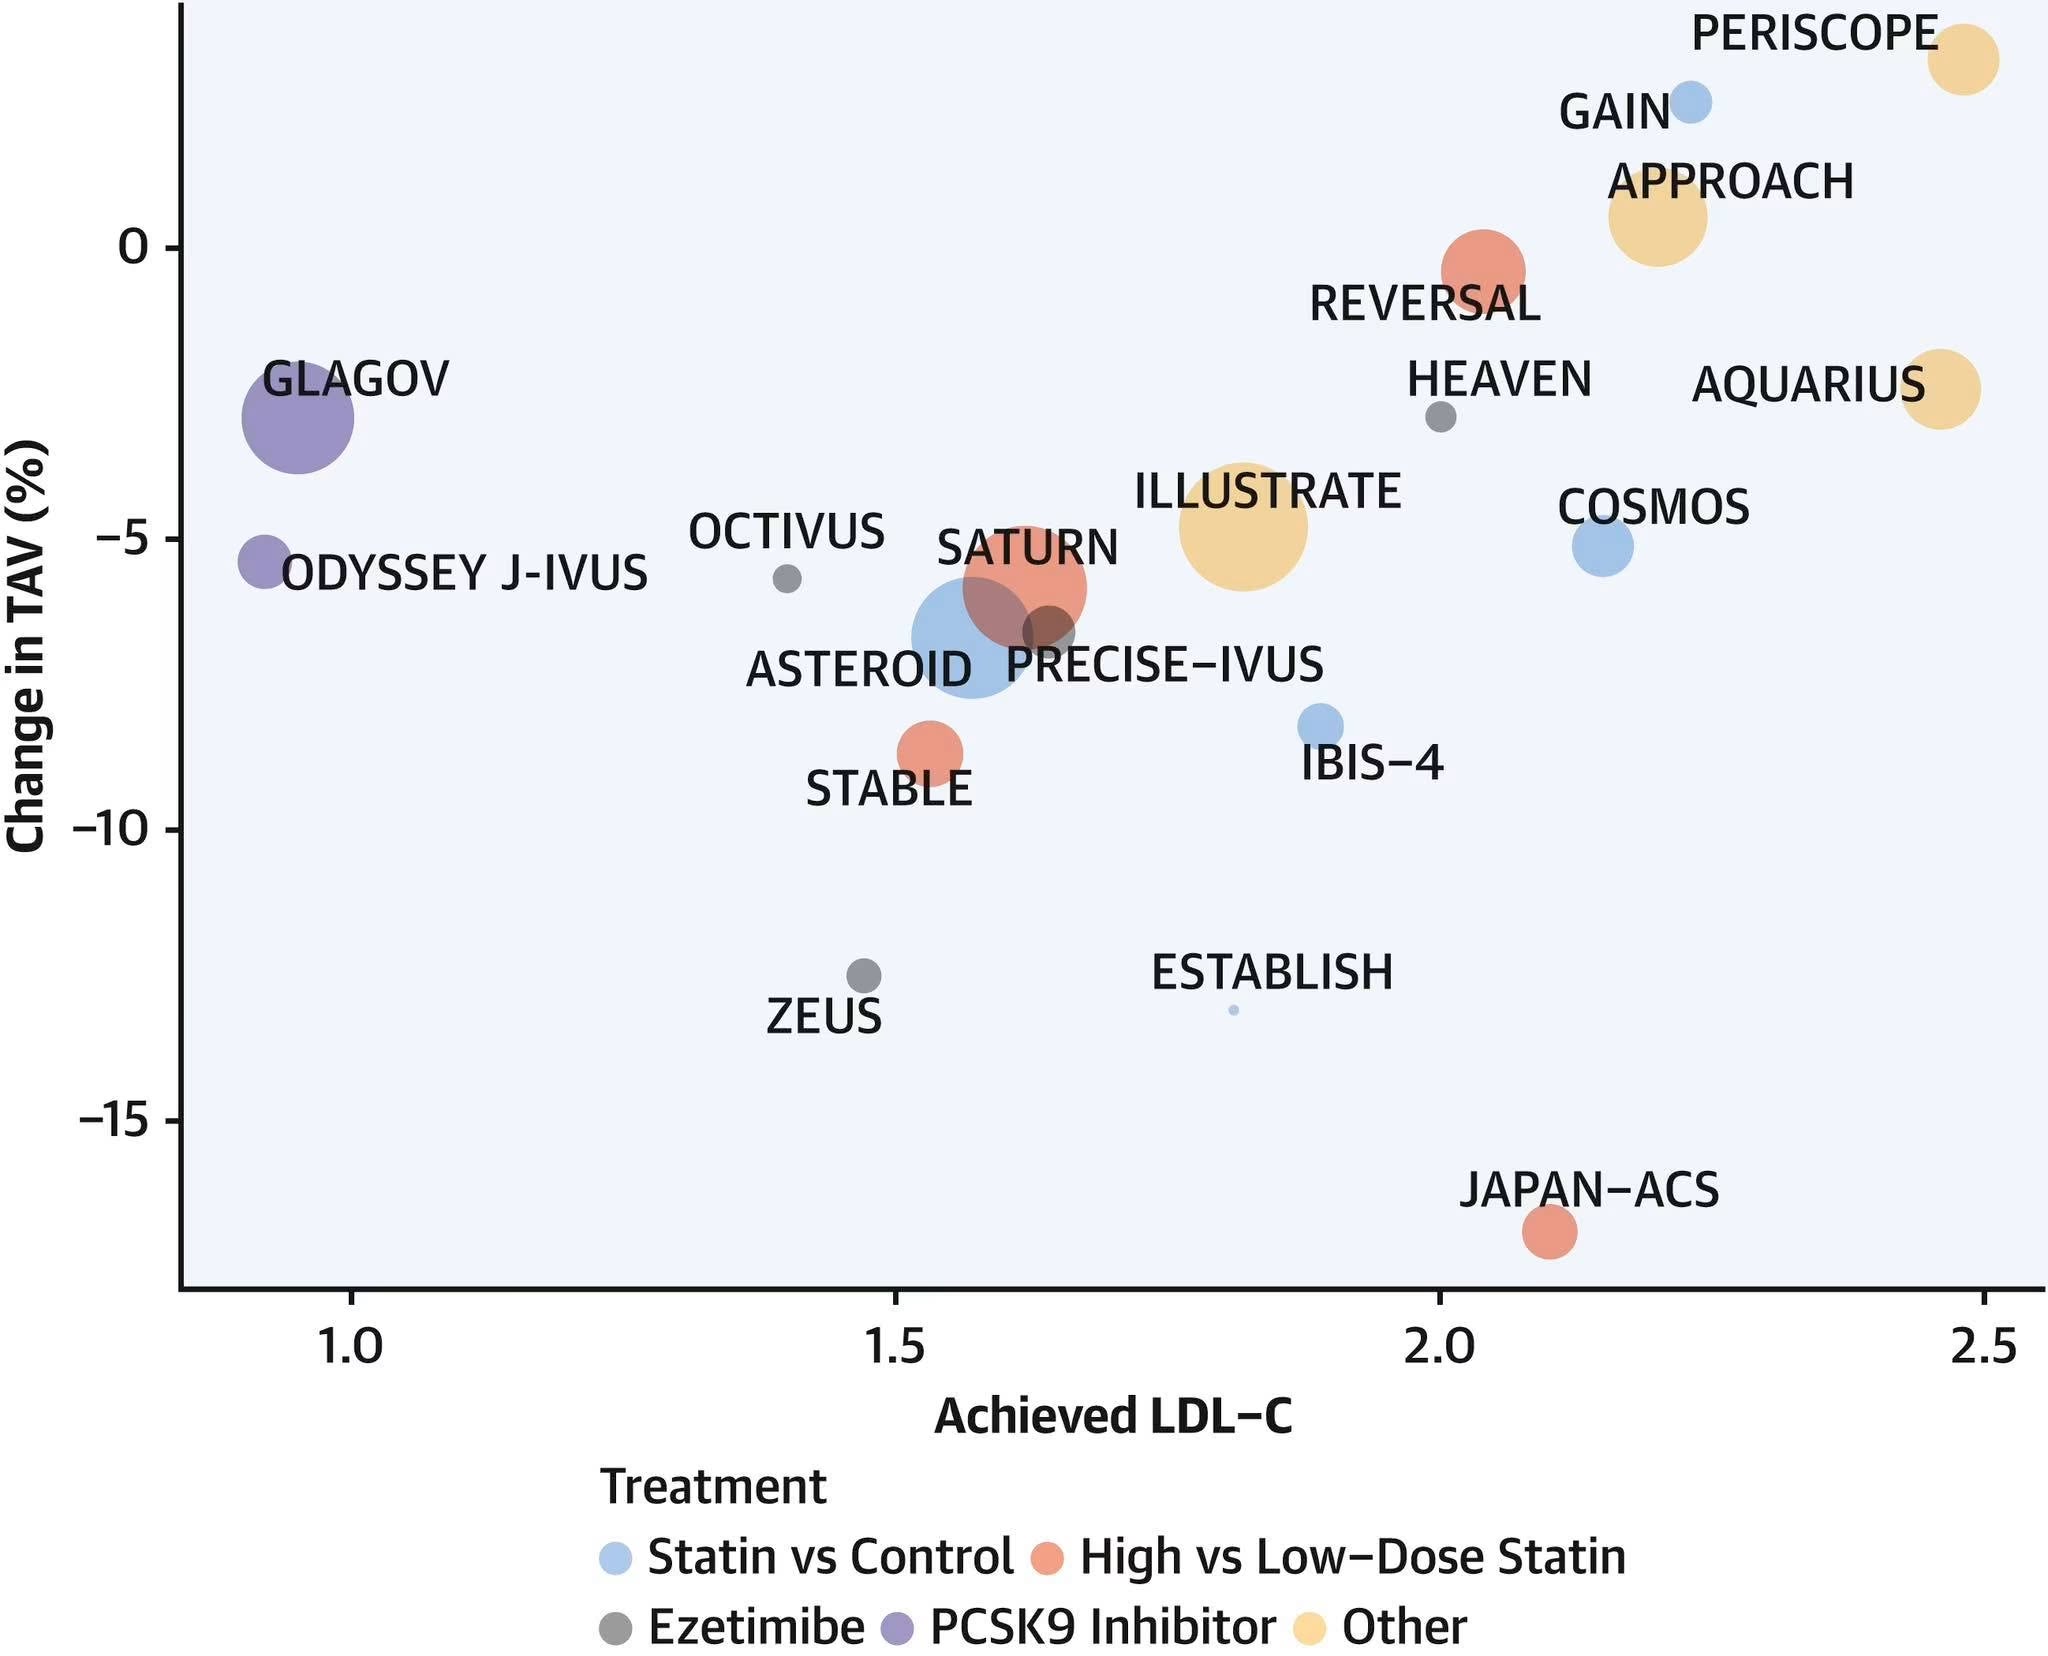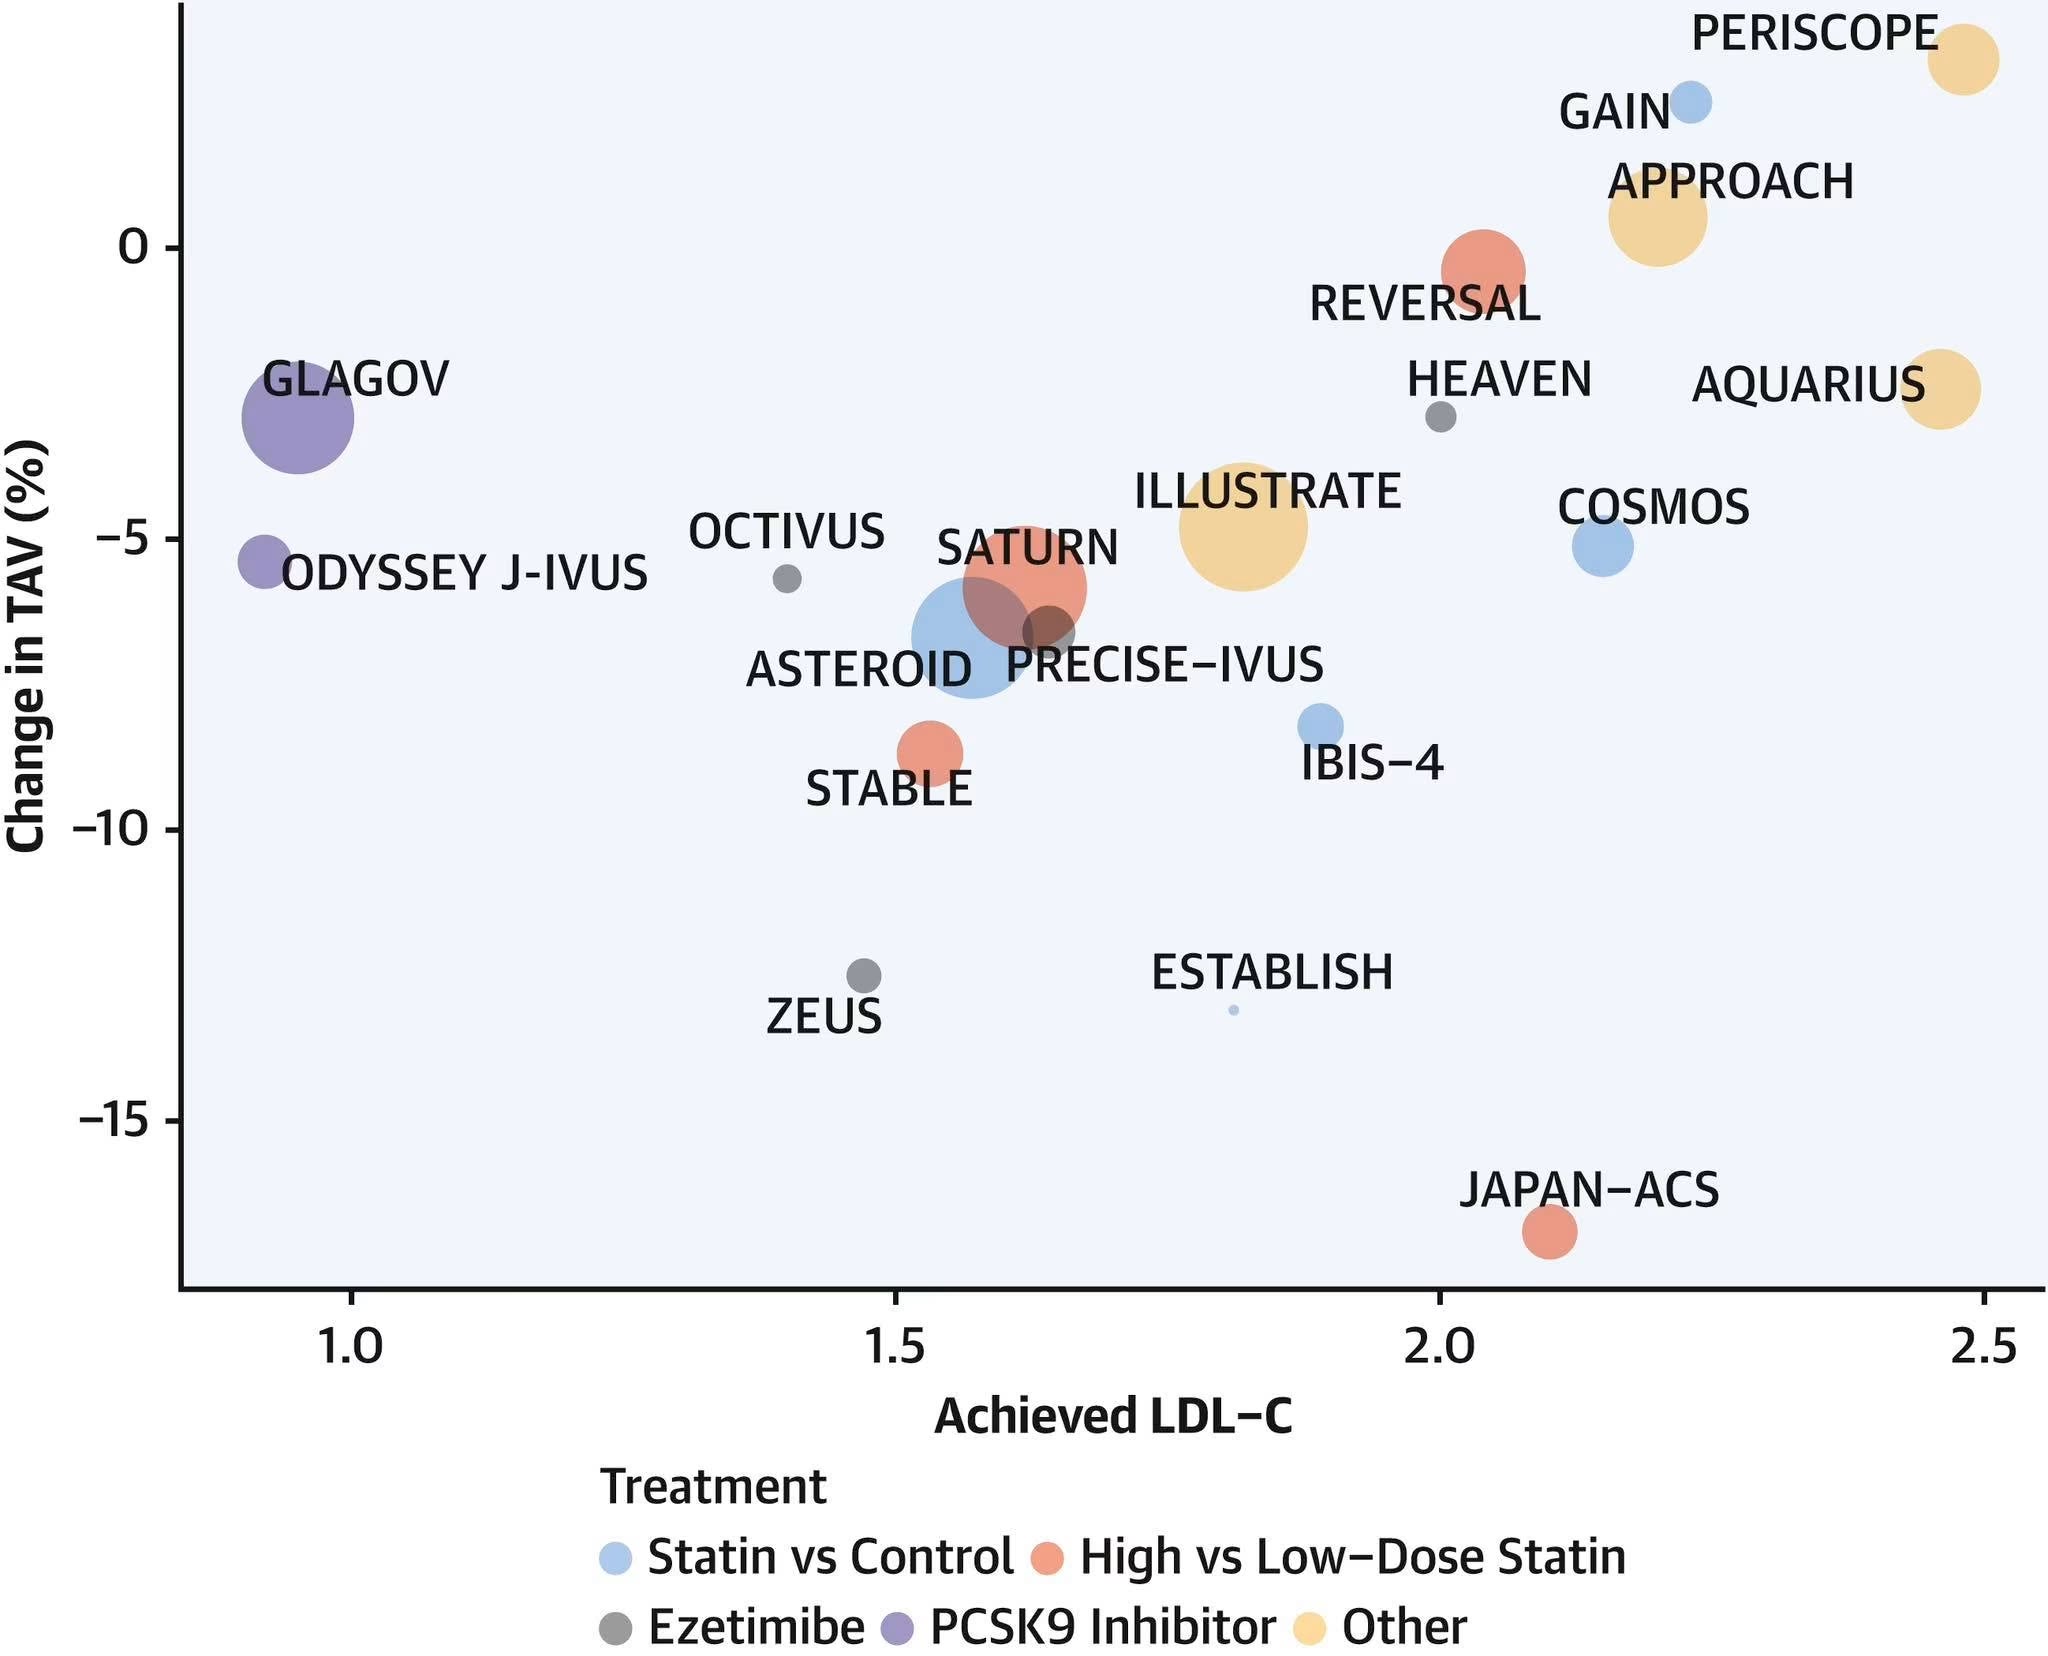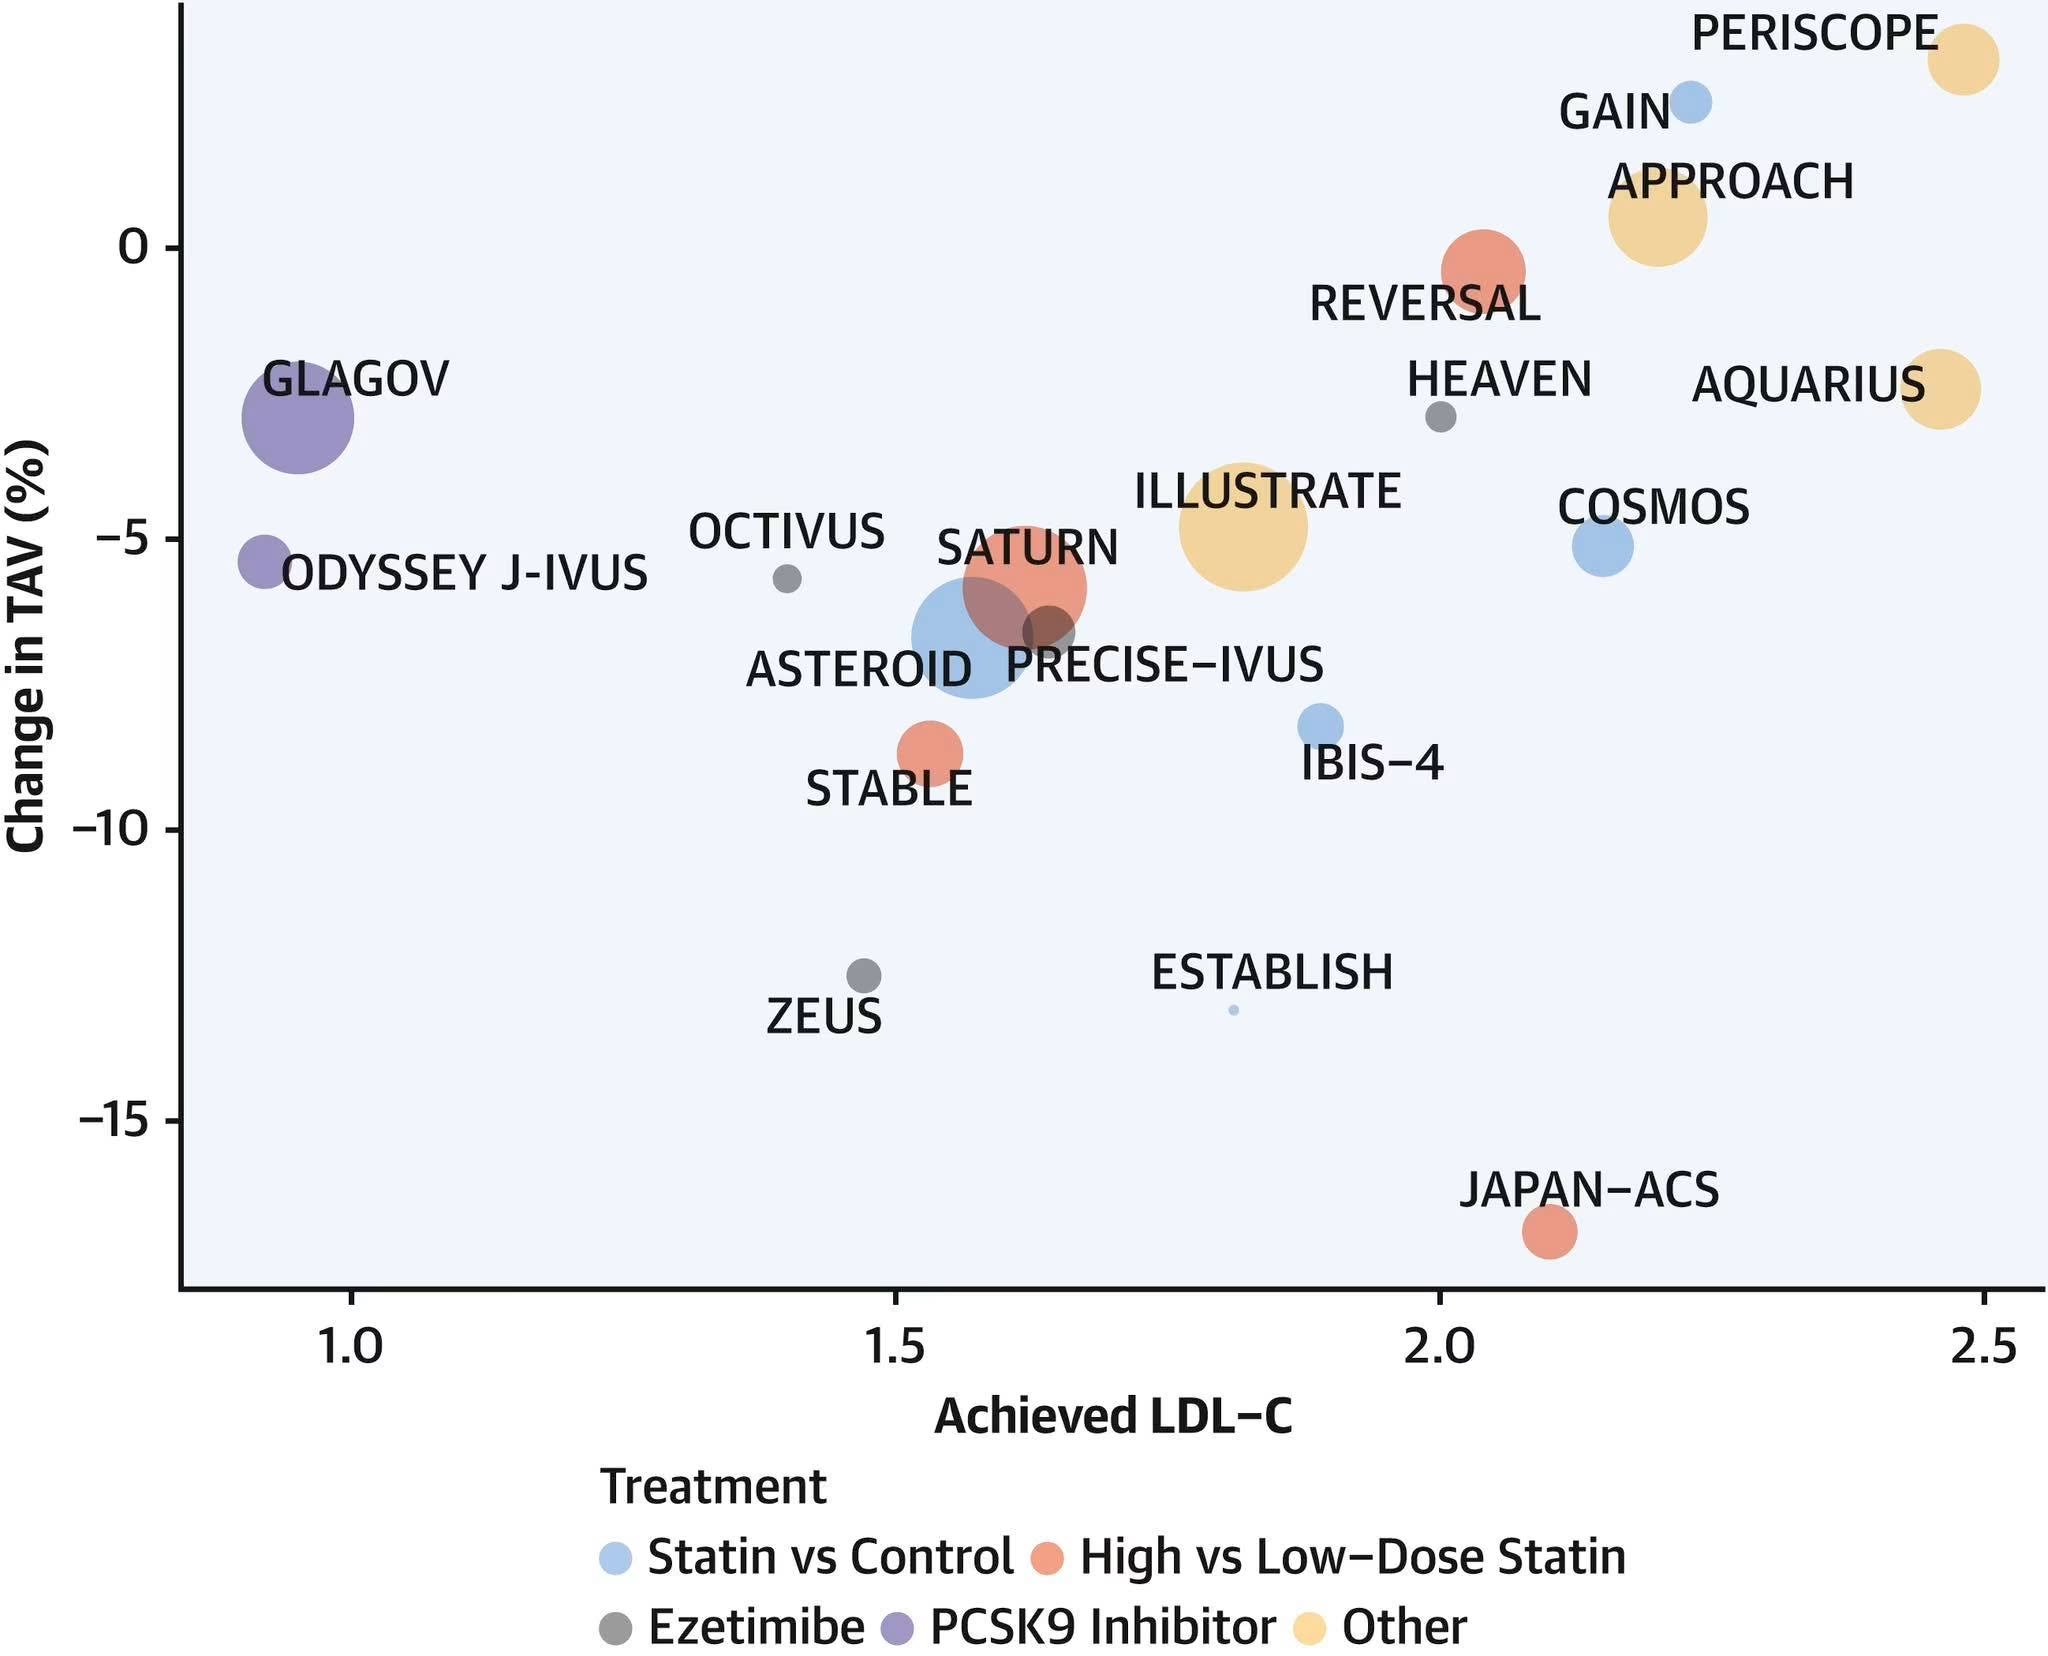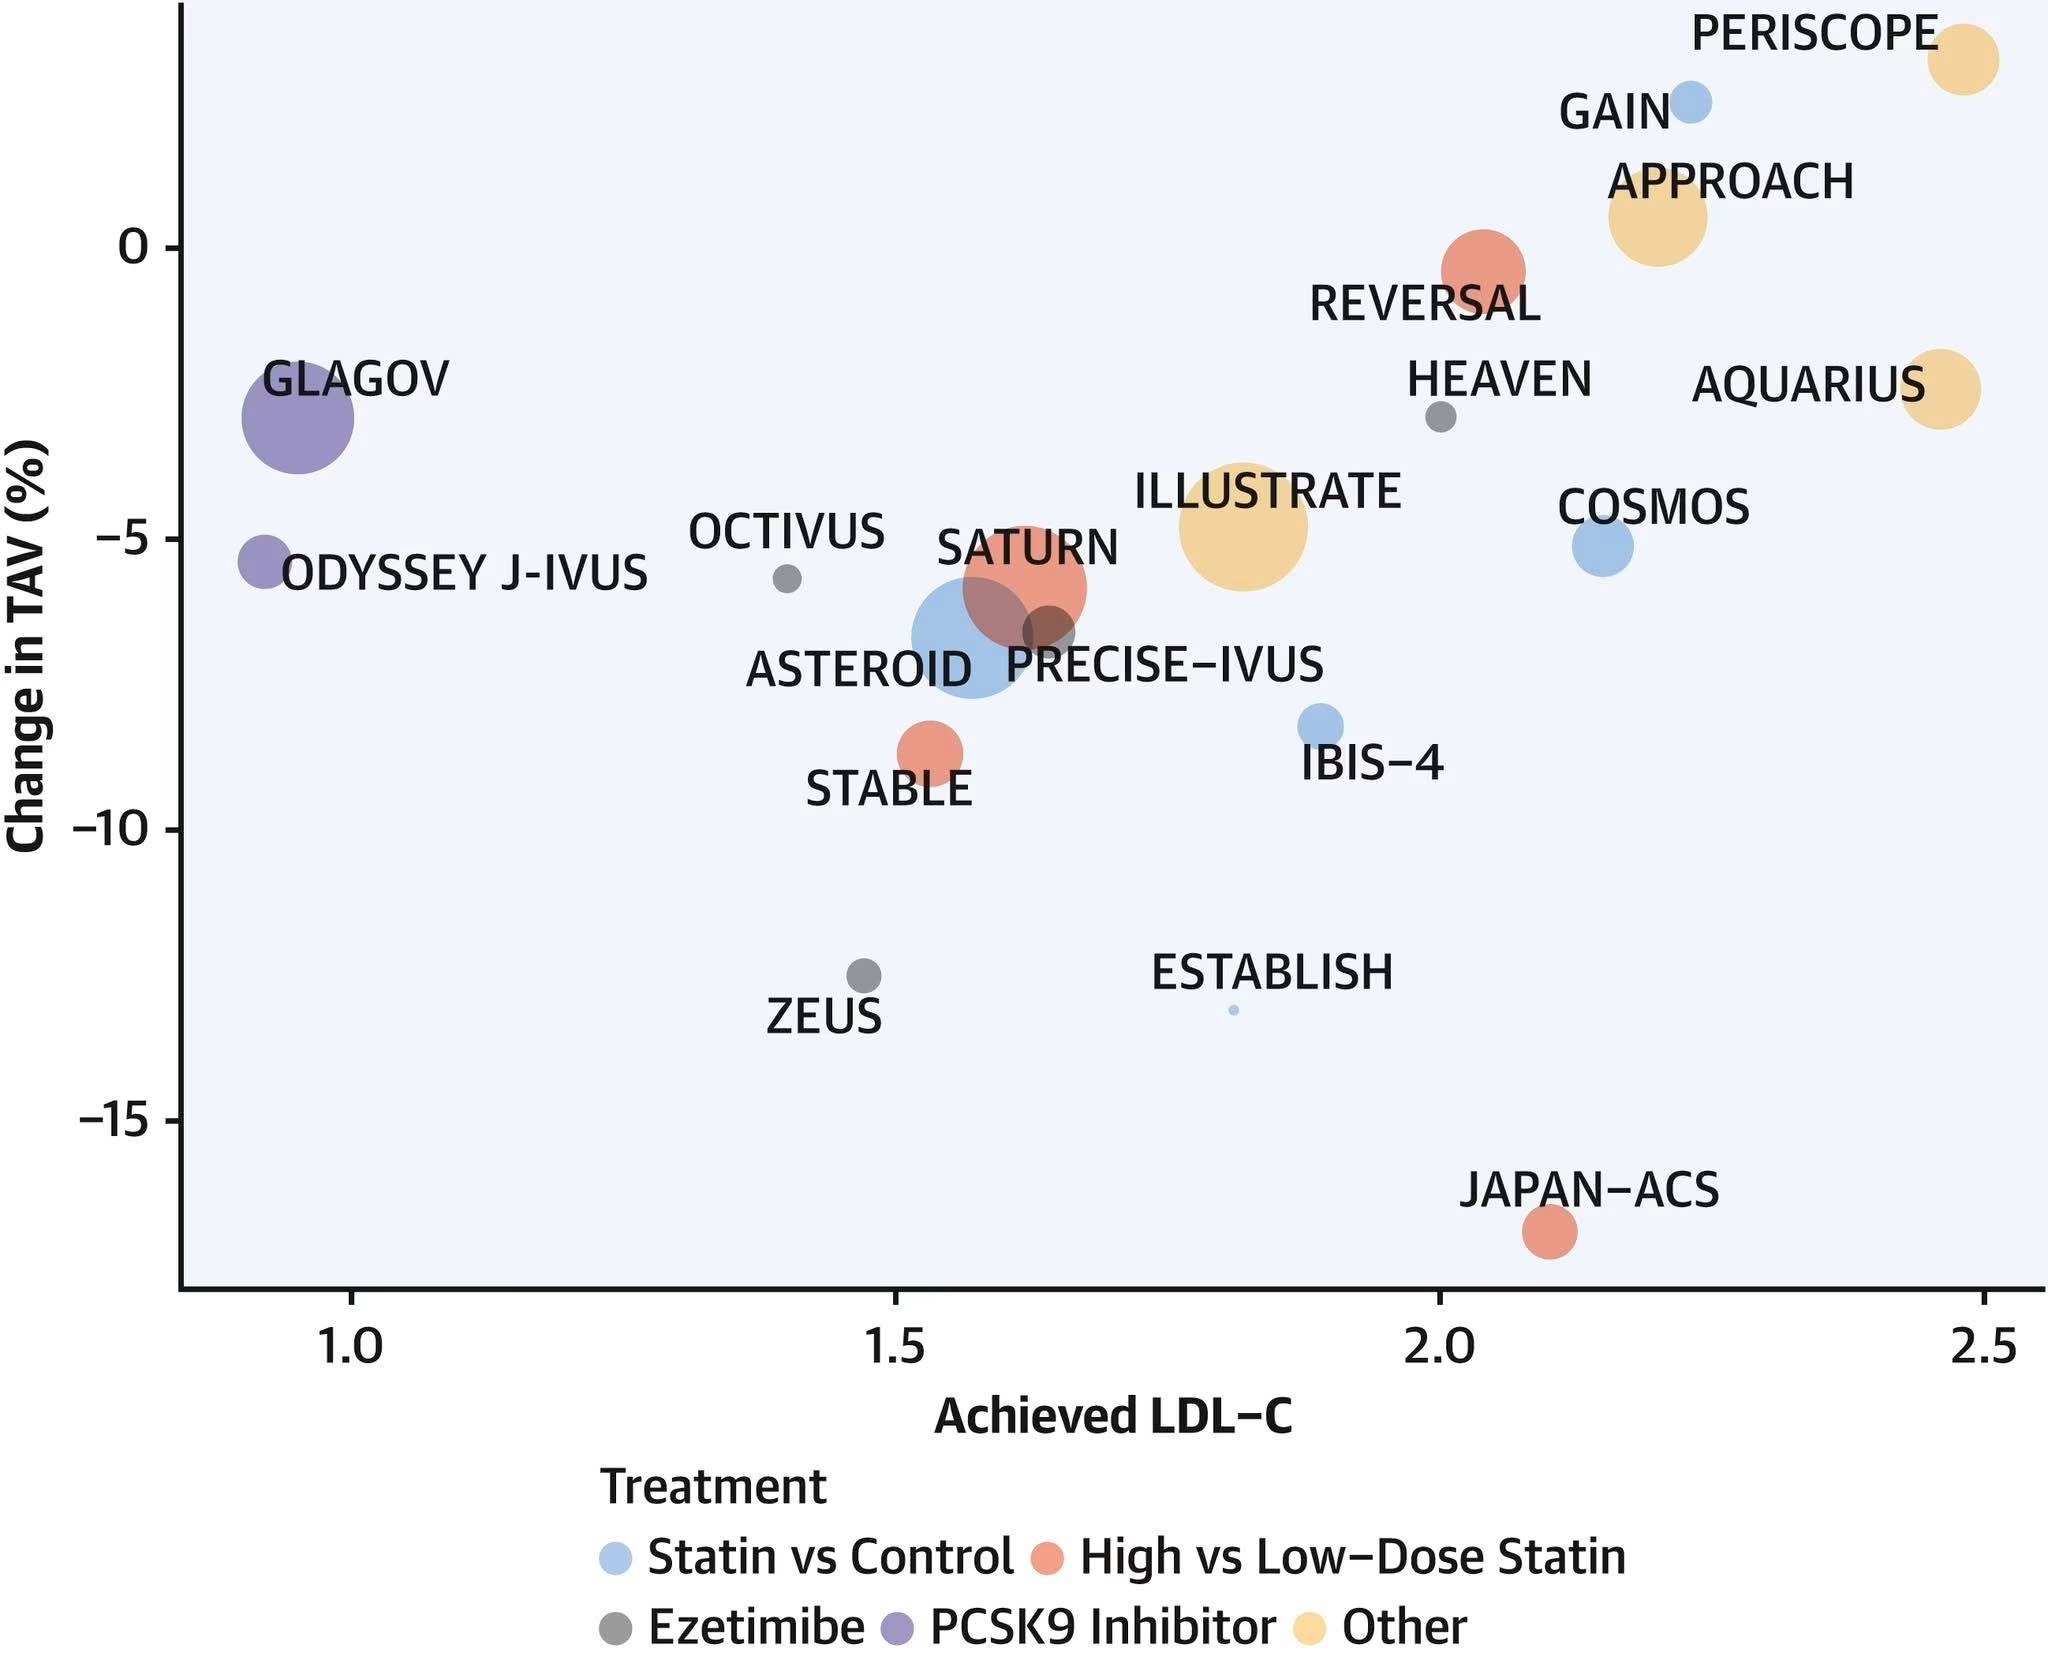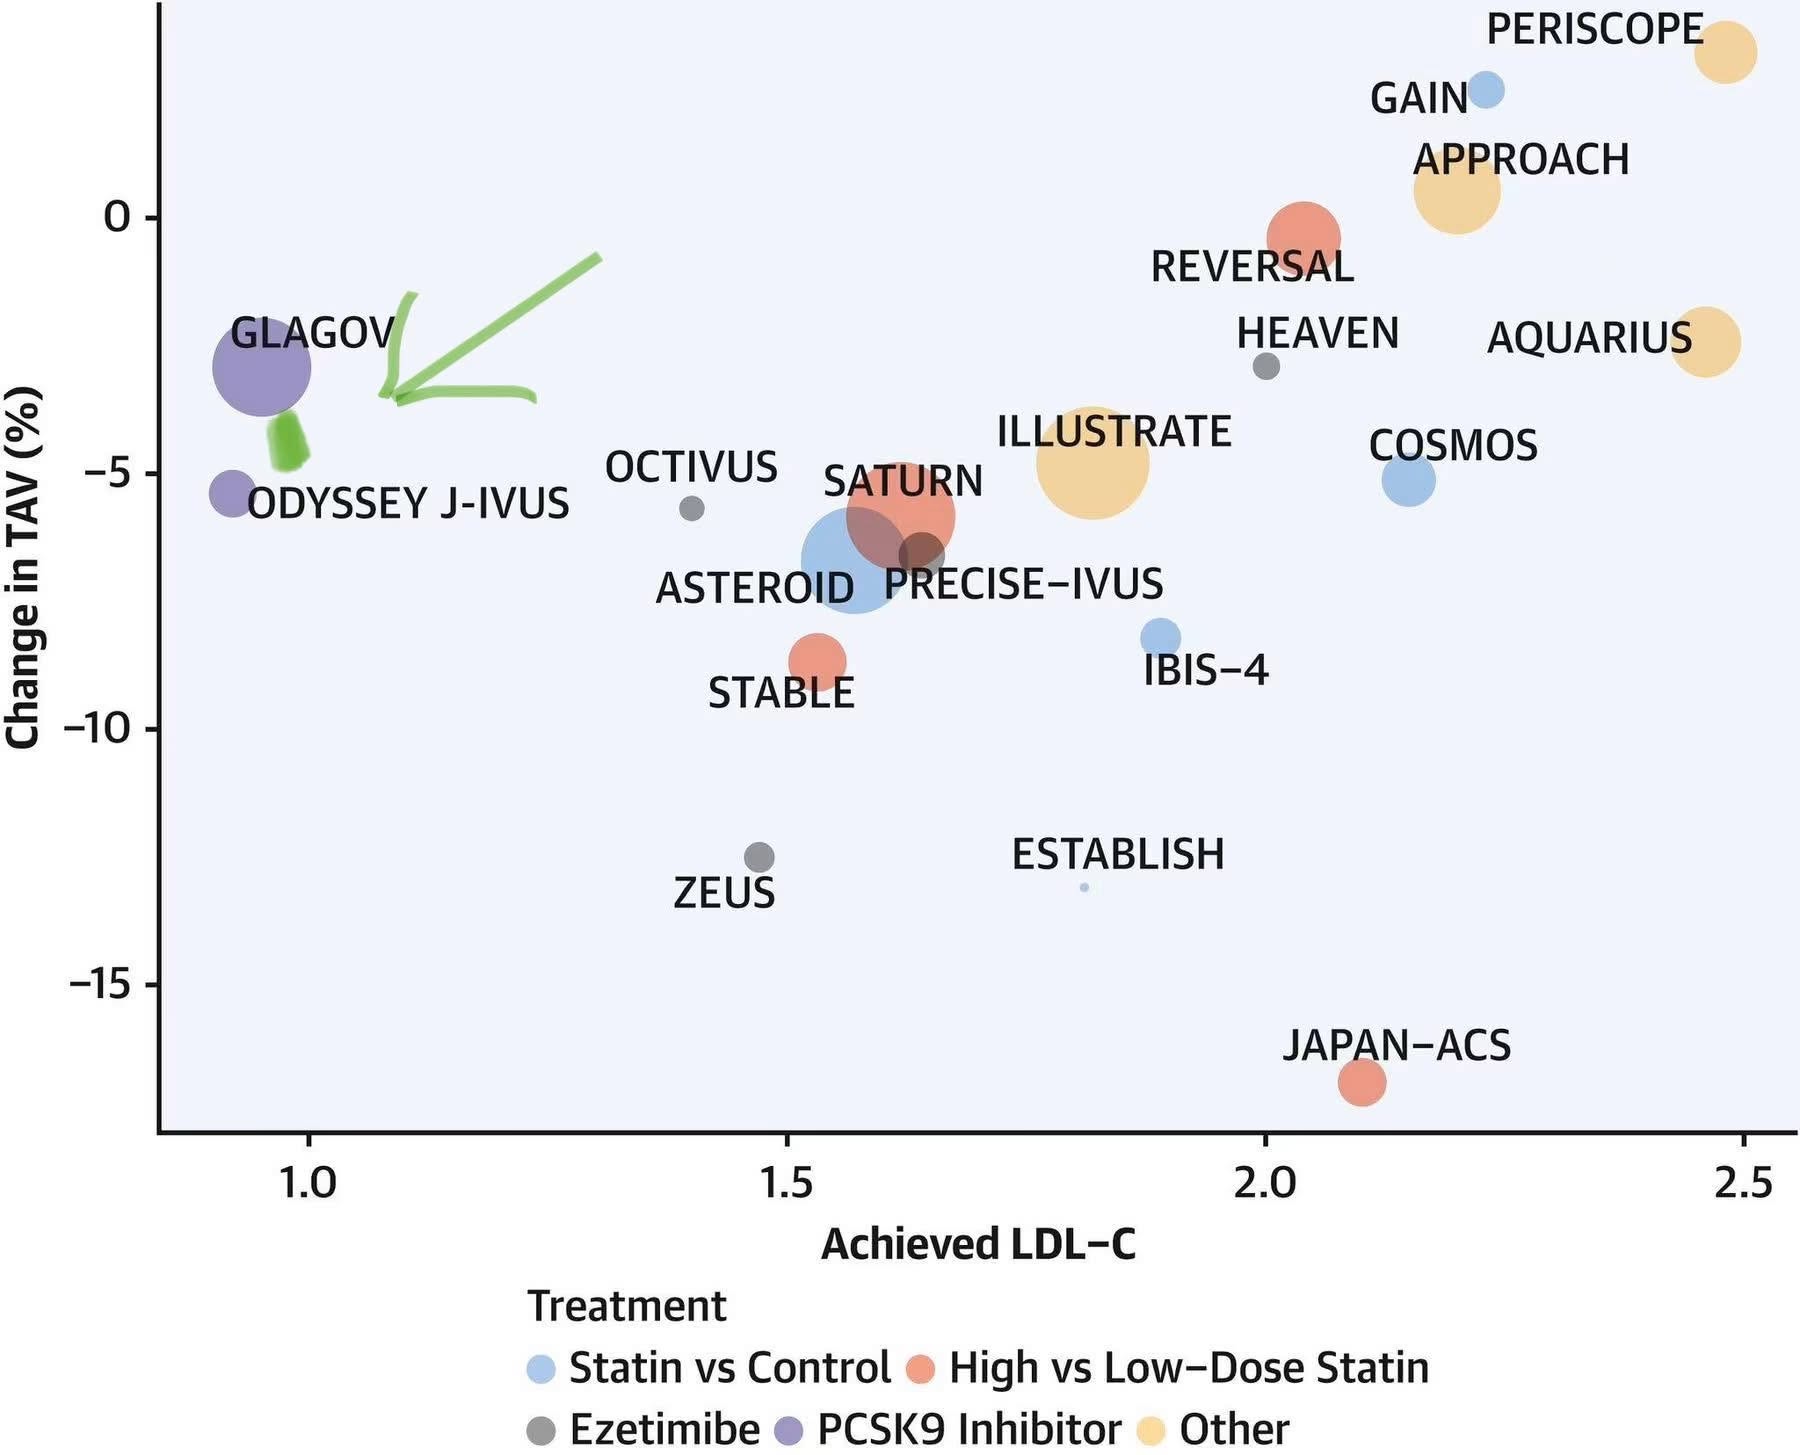
I added a green dot to this chart, so people can see how the plaque reversal in the recent YELLOW-III trial compares to previous trials.
As a reminder, YELLOW-III used high dose statins plus the addition of a PCSK9 inhibitor.
The details of the trial were described in these previous posts:
↪ YELLOW-III: statin plus evolocumab thickened fibrous caps over 30% in 6 months
facebook.com/share/v/1ET5kJQdpM
For a description of this chart, see this previous post:
↪ Plaque volume begins to regress once LDL-C falls below about 90 mg/dL across RCTs
While not as large as some of the other trials… keep in mind that this reversal happened in only 6 months! It was also accompanied by a significant stabilization of existing plaque.
Here is the math on how the green dot was calculated:
The starting total atheroma volume (TAV) in this trial was 137.2 mm^3. The decrease in TAV was -6.0 mm^3. So the percent decrease in TAV was -6.0 / 137.2 = -4.4%. This sets the location on the y-axis.
The average LDL in this trial (after treatment) was 39.1 mg/dL, or roughly 1 mmol/L. This sets the location on the x-axis.
#reverseHD #statinreverseHD #pcsk9reverseHD #tavHD #plaqueHD #ivusHD #lipidcoreHD #statinsHD #pcsk9HD #yellowiiiHD #meltingbuttersignHD