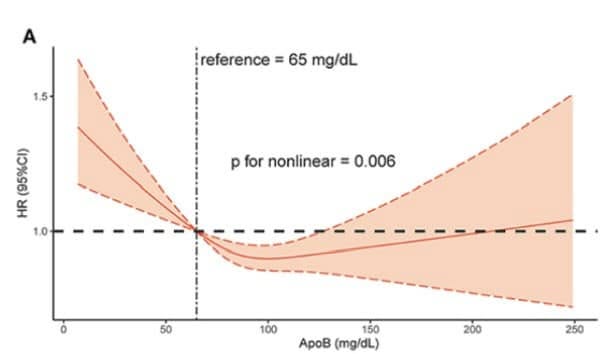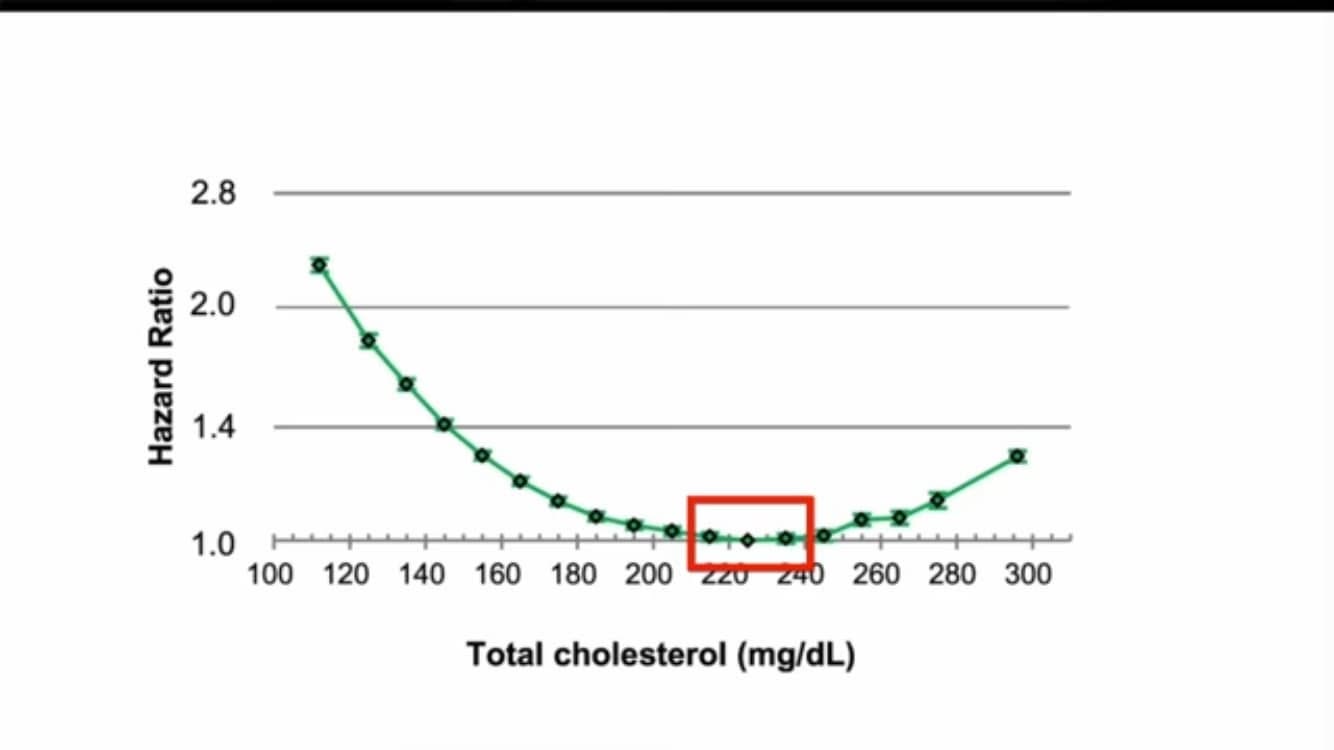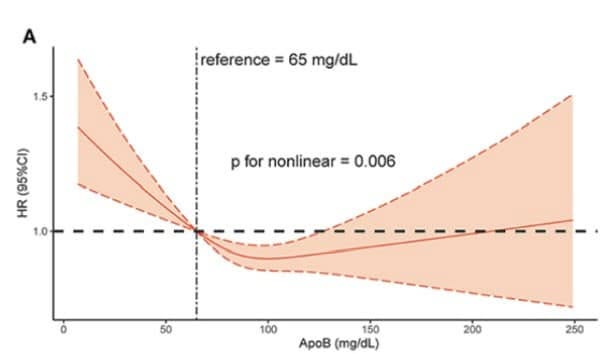
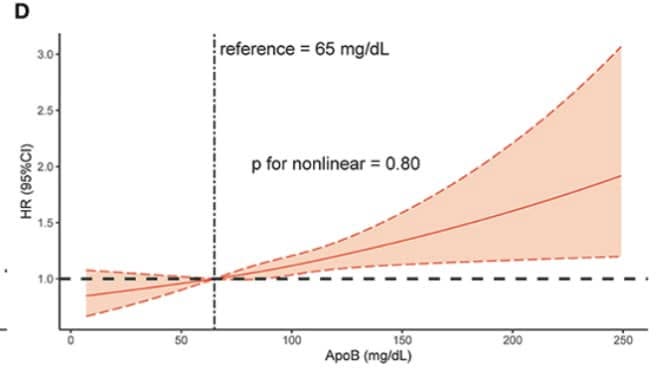
There is a commonly observed U-shaped curve between ApoB (or LDL) and all-cause mortality in observational studies (figure A).
Randomized controlled trials and Mendelian randomization studies have demonstrated that this U-shaped curve is unlikely causal at lower levels of ApoB, but the exact reasons for this U-shaped curve are not fully understood.
A large prospective cohort study of 36,500 people in China, published in 2022, sheds light on this.
This U-shaped curve becomes linear after proper correction for: comorbidities, bilirubin, and wasting-associated malnutrition often seen in the elderly (figure D).
In other words, these other factors which increase mortality (comorbidities, bilirubin, malnutrition) cause ApoB to be lower in older people. The resulting increased risk of mortality from these factors likely causes low ApoB in older people, and not the other way around.
In these plots, the x-axis is ApoB and the y-axis is all-cause mortality (measured as a hazard ratio). Figure A from the paper is uncorrected, and figure D is corrected.
Here is the full study:
Paper · Front Cardiovasc Med · 2022Paradoxical Association Between Baseline Apolipoprotein B and Prognosis in Coronary Artery Disease: A 36,460 Chinese Cohort Study.Conclusion: This study found a paradoxical association between baseline ApoB and long-term all-cause mortality. Malnutrition and bilirubin mainly mediate the ApoB paradox. Increased ApoB concentration remained linearly associated with an increased risk of long-term all-cause mortality.frontiersin.orgQuoted from the study:
“According to the Kaplan-Meier curve, there is a paradoxical association between baseline ApoB concentration and long-term prognosis [U-shaped curve], in which low baseline ApoB was associated with a high risk of poor outcomes. After considering the baseline discrepancies including age, sex, and comorbidities, the association between low ApoB level and worse prognosis was insignificant. Taking nutrition status and total bilirubin level into consideration, high baseline serum concentration of ApoB was one of the factors which can affect long-term all-cause mortality independently. The apolipoprotein paradox [U-shaped curve] has been observed in CAD patients, but it would no longer exist by taking the effects of malnutrition and bilirubin into account. The paradoxical association between ApoB and worse prognosis was mainly mediated by the effect of bilirubin and underlying malnutrition.”