More comments on the rapid plaque progression in the LMHR study:
As a remider, these were lean metabolically-healthy people with very high LDL (254 mg/dL) on a keto diet for one year.
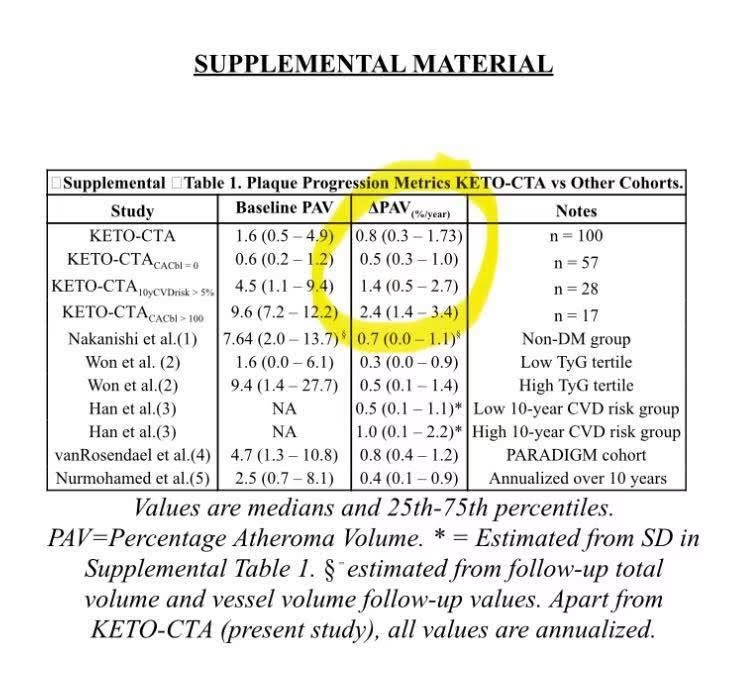
As the table from the paper shows:
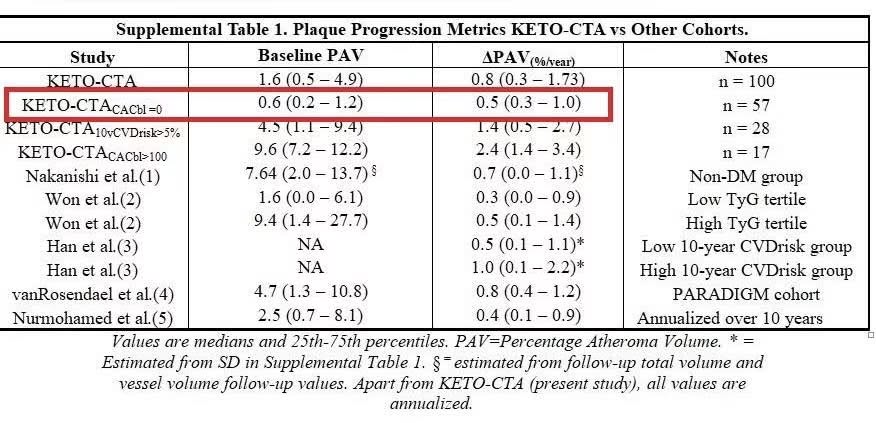
- People with CAC = 0 to start saw their total plaque volume (PAV) almost double in one year!
They began with a baseline PAV of 0.6%. It increased by another 0.5% in one year, for a final value of 1.1%.
- The average person in the study saw their total plaque volume (PAV) increase by 50% in one year!
They began with a baseline PAV of 1.6%. It increased by another 0.8% in one year, for a final value of 2.4%.
- People with 10 year risk > 5% in the standard AHA calculator saw their total plaque increase by over 30% in one year.
They began with a baseline PAV of 4.5%. It increased by another 1.4% in one year, for a final value of 5.9%.
The percentage increase is smaller in this case because the starting PAV was higher, as you would expect in people at higher risk.
- People with CAC > 100 to start saw their total plaque increase by 25% in one year.
They began with a baseline PAV of 9.6%. It increased by another 2.4% in one year, for a final value of 12%.
The percentage increase was again smaller in this case because the starting PAV was much higher, as you would expect in people with a high CAC score.
Reference for table:
jacc.orgLink to jacc.orgjacc.org———-
Note:
PAV is a measure of total plaque volume.
It represents the sum of all plaque, both soft and hard.
The units of PAV are in percent. PAV represents the percent of the total scanned vessel volume that is occupied by plaque.
In the case boxed in red on the table, the average person went from having 0.6% of their scanned vessel volume occupied by plaque up to 1.1% after one year.
These PAV numbers are the median (average) around which there is a gaussian distribution (e.g. characterized by a standard deviation).