The short answer from the group's posts is that a handful of numbers do most of the work. For cholesterol, the group's admins favor ApoB (a count of plaque-forming particles) alongside LDL cholesterol and a one-time Lp(a). For blood pressure, they cite systolic readings under 120 mmHg as ideal. For metabolism, they look at HbA1c and, more sensitively, insulin-based measures such as HOMA-IR. Inflammation (hs-CRP) and a plaque imaging test round out the picture12.
Two caveats run through the posts. First, targets are not one-size-fits-all: LDL targets in particular scale with a person's absolute risk, and several posts warn against pushing very low values in people at low risk34. Second, many figures come from admin summaries of videos, guidelines and papers, so they are quoted here with attribution. The group's admins recommend discussing your own targets with your doctor.
The targets quoted in the posts, at a glance:
| Number | Quoted target | Source |
|---|---|---|
| LDL-C | under 100 mg/dL (borderline or intermediate risk), under 70 (high risk), under 55 (very high risk) | 2026 ACC/AHA guideline summary8 |
| ApoB | under 100 mg/dL if healthy, under 80 at high risk | Gil Carvalho, summarized by Gokhan2 |
| Lp(a) | generally under 75 nmol/L; 125 nmol/L (50 mg/dL) or higher is flagged as high | Carvalho; 2026 ACC/AHA guideline28 |
| Triglycerides | under 150 mg/dL (VLDL cholesterol under 30), likely lower at high risk | Louis Nervegna9 |
| Systolic blood pressure | under 120 mmHg ideal; drug-treatment target under 130 | Brad Stanfield, shared by Gokhan10 |
| HOMA-IR | under 1.0 ideal; over 2.0 insulin resistance; over 3.0 frank resistance | Carvalho2 |
| HbA1c | under 5.7%; a rise from 5.1 to 5.5 is a red flag | Carvalho2 |
The lipid numbers
LDL-C: cholesterol carried in LDL particles
Your lab report's LDL-C measures the cholesterol inside LDL particles, and Louis Nervegna points out it also includes cholesterol carried by Lp(a) particles, so in someone with very high Lp(a) a significant share of reported LDL-C comes from Lp(a)1112. Genetics, Mendelian randomization and randomized trials support LDL and ApoB as causal risk factors rather than mere markers, according to an NEJM review Louis shared3.
ApoB: counting the particles
ApoB is a protein tag on every atherogenic particle (LDL, VLDL and Lp(a)), so an ApoB test counts the total number of those particles13. Louis explains that LDL-C and LDL-P (LDL particle number) can disagree: someone can have a low LDL-C but many small particles, and particle number predicts risk better than cholesterol content14. The group has shared an explainer on this "discordance"15, and a National Lipid Association consensus summary says ApoB is more accurate than LDL-C when the two diverge, particularly after statins, and is most useful for borderline-risk people deciding on a statin or those considering intensifying treatment, without being required for everyone16. A 2025 European Heart Journal paper concluded that lipid-related risk is best reflected by total ApoB particle count, largely independent of particle type or size, with elevated Lp(a) adding risk17.
Quoted targets: Gokhan Can's summary of Dr. Gil Carvalho gives ApoB ideally under 100 mg/dL for healthy people and under 80 for those at high risk2. The 2026 ACC/AHA guideline is quoted as saying ApoB may be used to assess residual risk and guide treatment, for example in people with cardiovascular-kidney-metabolic syndrome, type 2 diabetes, high triglycerides or known CVD who have already reached their LDL-C goals8.
You cannot compute ApoB from a standard panel, but non-HDL cholesterol (total minus HDL) is a rough proxy, and Louis shares a crude conversion of ApoB at about 0.7 times non-HDL-C, while stressing that a direct ApoB test is more accurate18. Mendelian randomization work Gokhan summarized found that genetically higher ApoB shortened healthspan, with an effect independent of LDL, and may raise Alzheimer's risk (the larger replication was attenuated)19.
Triglycerides and VLDL
Triglycerides are mostly carried by VLDL, an ApoB-tagged particle20. Louis estimates VLDL cholesterol as triglycerides divided by 5, with a normal VLDL below 30 mg/dL corresponding to triglycerides below 150 mg/dL, and says optimal is likely lower in high-risk people9. He also explains why triglycerides below 400 mg/dL are said not to matter in some discussions: they do matter, but they are already counted in ApoB, so adding them separately double counts risk21. In the BRIDGE-TIMI 73a trial, olezarsen cut triglycerides 64% with no change in plaque volume, and Louis argues that unless triglycerides exceed about 400-500 mg/dL, drug-lowering them makes little difference to plaque or hard outcomes22.
HDL: not a target to chase
Louis agrees with a post summarizing five major trials of HDL-raising drugs (niacin and CETP inhibitors) that failed to reduce events; in ILLUMINATE, for example, HDL rose 72% and cardiovascular death increased. He adds that risk falls only when HDL rises as a side effect of better insulin sensitivity, and that some HDL subfractions might still prove protective23.
Tests that add little
- LDL particle size. An NMR report itself states that small LDL-P and size are associated with CVD risk, but not after LDL-P is taken into account, and ApoB is an equivalent particle count242526. Gokhan advises against paying for NMR size panels, citing a genetic analysis in about 200,000 people over 14 years in which ApoB and Lp(a) best captured lipid-driven risk27.
- Oxidized LDL in blood. Louis says the association with CVD disappears or shrinks after adjusting for ApoB, because meaningful oxidation happens inside the artery wall, which no commercial test measures28.
- Promotional explainers. One shared explainer claims ApoB, Lp(a), UACR and HbA1c reveal risks standard labs miss. It gives no studies and the claim that 20% of people carry Lp(a) risk is only asserted there29. Louis also shared a short explainer that standard panels do not capture Lp(a), remnants and ApoB-rich particles30.
LDL targets by risk
Several sources in the group agree on the broad structure.
- 2026 ACC/AHA guideline (as summarized by Louis): under 100 mg/dL to prevent a first heart attack or stroke in borderline or intermediate risk, under 70 in high risk, and under 55 for people with ASCVD at very high risk8. A separate summary says explicit targets are back, and that a CAC score above 300 now triggers the highest-risk category with an LDL target under 5531.
- ESC/EAS guideline (as shared by Louis): very high risk under 55 (under 40 in selected people with recurrent ASCVD), high risk under 70, moderate risk under 100 (consider), and low risk under 116 (may consider)3233.
- 2023 JAHA review (summarized by Gokhan): high risk (10-year ASCVD risk of 20% or more) means at least a 50% LDL-C reduction and a goal under 70; very high risk means at least 50% reduction and under 55, or under 40 after recurrent events on statins. Statins are first-line, with ezetimibe, a PCSK9 inhibitor, bempedoic acid or inclisiran considered if the goal is not met34.
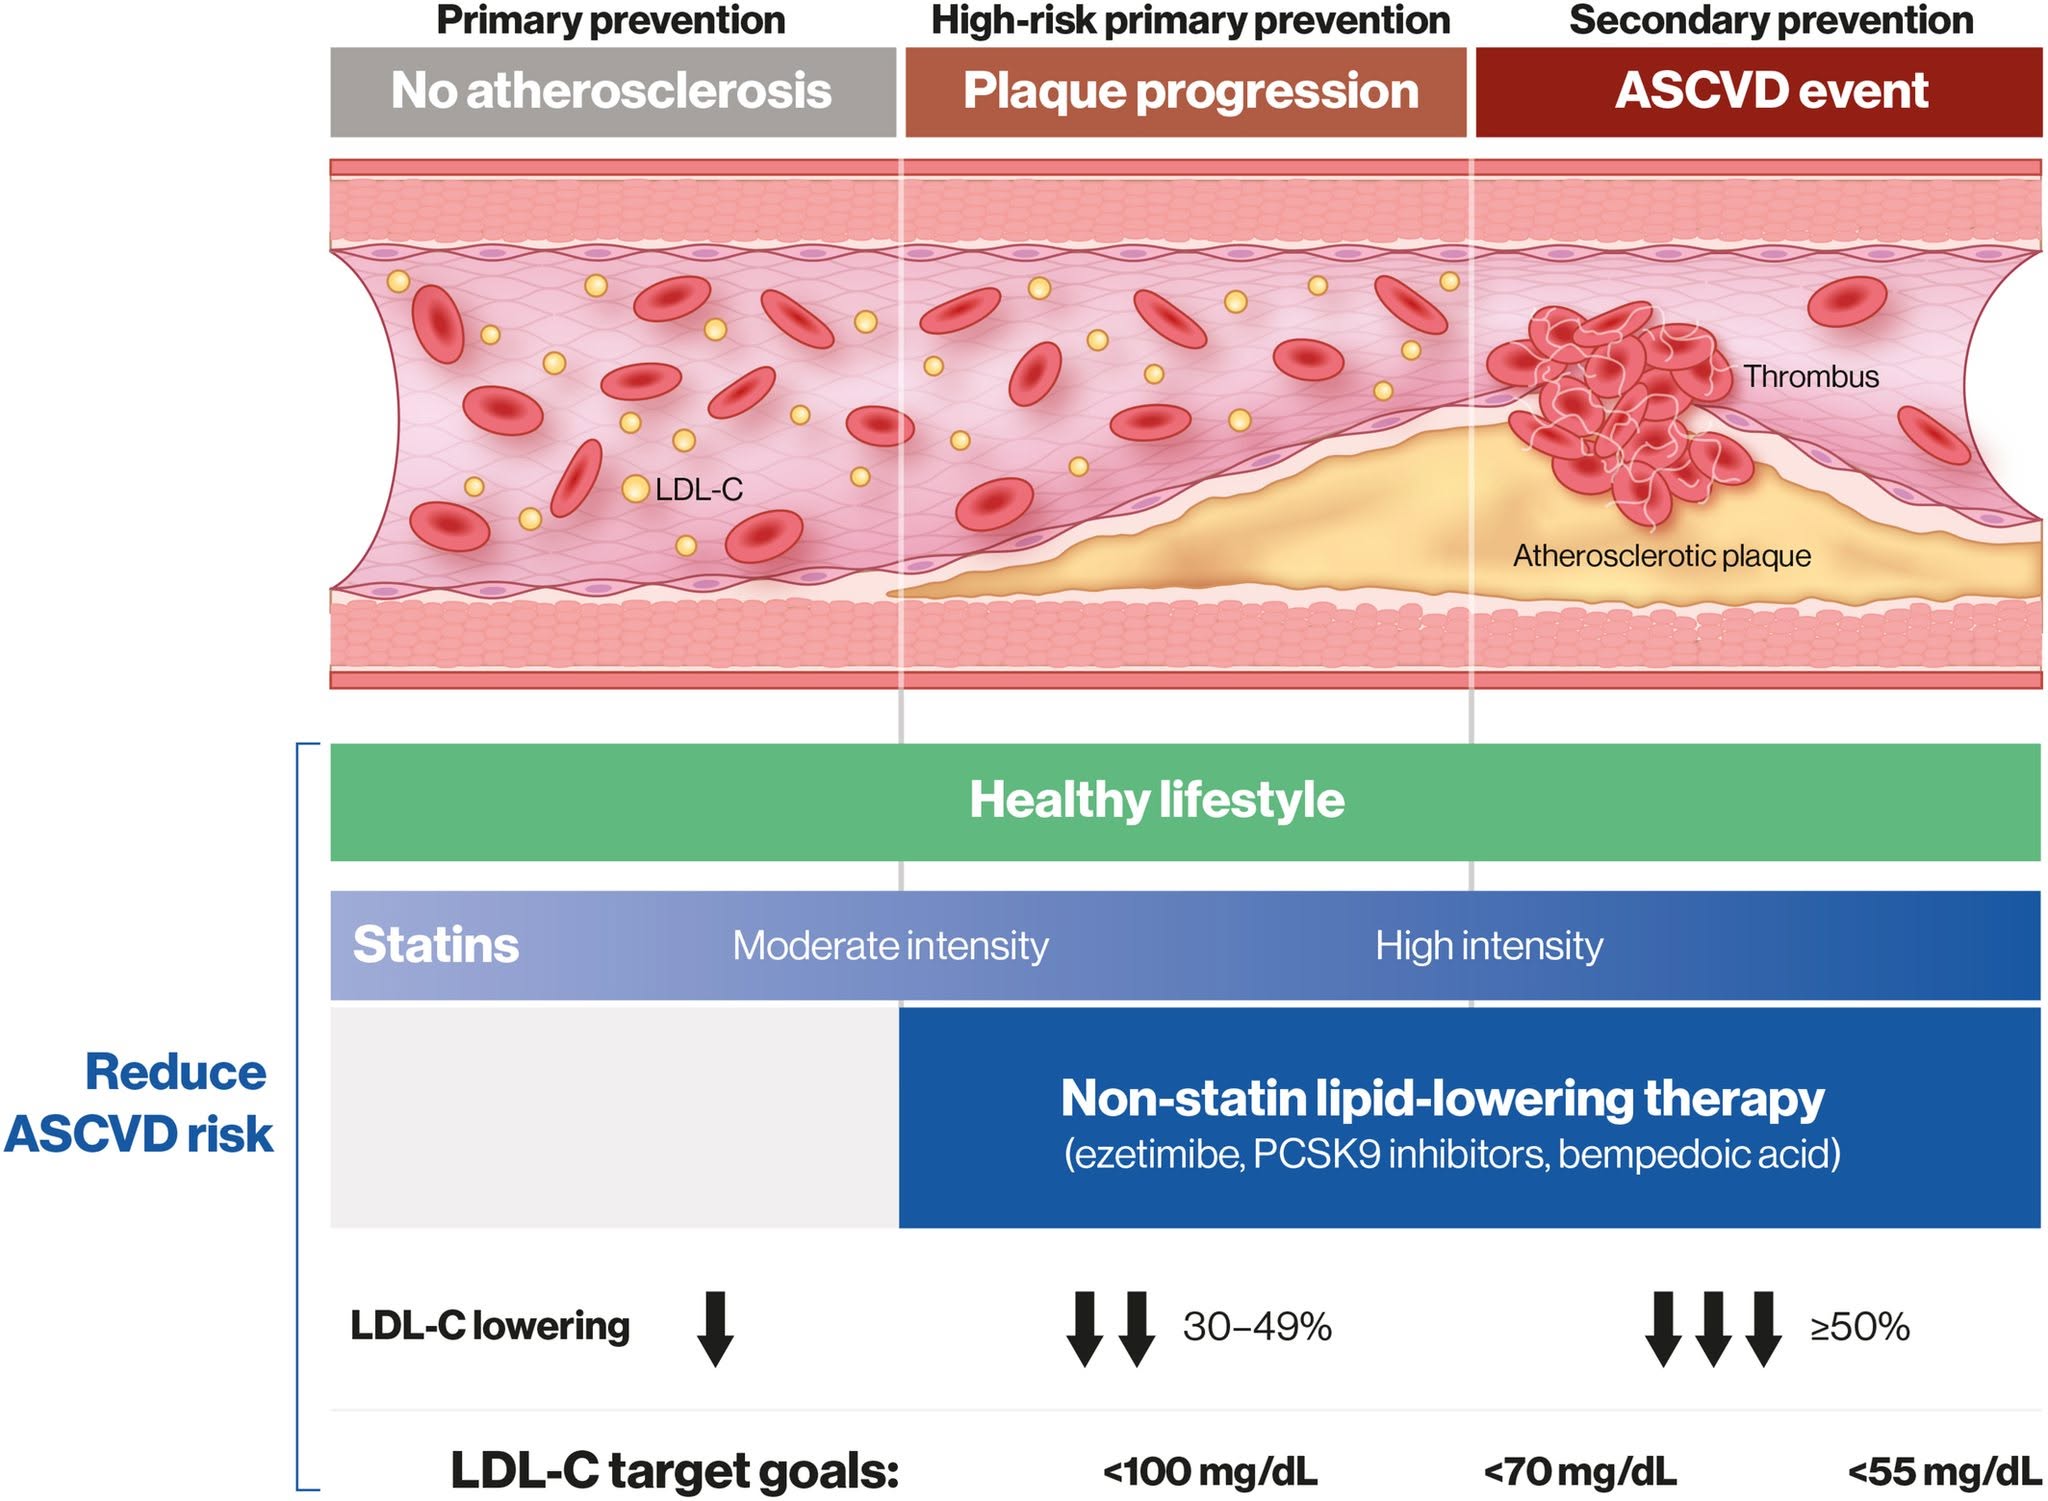
Evidence for lower targets includes the EZ-PAVE randomized trial of over 3,000 people with established heart disease, in which an LDL goal under 55 (statin plus ezetimibe) had 6.6% major events over 3 years versus 9.7% with a goal under 70 (statin alone), with similar safety35. In imaging studies, Louis quotes an interview stating that at LDL near 80 mg/dL about half of people showed plaque regression, and below 60 about 90% of regressable lipid-rich plaques regressed36. A JACC Advances study of 1,033 asymptomatic adults aged 40-65 classified as low risk found 35.9% had coronary plaque, with atherosclerosis rising linearly with LDL, non-HDL and ApoB even below guideline levels; Gokhan reads it as supporting LDL under 707.
How low is too low?
The group does not treat "lower is better" as unlimited.
- Gokhan notes expert opinion is shifting toward LDL under 30 as optimal, but this is not definitively proven in trials37.
- Louis criticizes advice for low-risk people to use multiple drugs to push LDL-C under 20, noting major cardiology associations do not recommend it, and quotes Walter Willett on a possible increase in hemorrhagic stroke at very low LDL. He says this does not apply to high-risk people, for whom the benefit outweighs the risk, and that targets should scale with risk4.
- An NEJM review he shared stresses proportionality, "not lower for everyone": focus on absolute risk, and use lifestyle rather than drugs in truly low-risk people3.
- Louis also reminds readers that residual risk persists in every randomized trial however low LDL goes, and that age is the largest risk factor, by his estimate over 10 times larger than LDL or ApoB38.
Statin choice matters less than reaching the target: both atorvastatin 40-80 mg and rosuvastatin 20-40 mg typically cut LDL-C by 50% or more, and in the LODESTAR trial three-year outcomes did not differ significantly39.
Lp(a): test once
Lp(a) is a genetically determined lipoprotein. Carvalho's summary says it is about 90% genetic, does not change much with diet, affects about one in five people and generally should be under 75 nmol/L, and need only be tested once2. The 2026 ACC/AHA guideline, as quoted by Louis, says to measure it at least once in adulthood; 125 nmol/L or higher (50 mg/dL or higher) carries about a 1.4-fold higher long-term risk of heart attack or stroke, and 250 nmol/L at least two-fold8. A summary of the guideline update says universal screening is now recommended, matching Europe and Canada31.
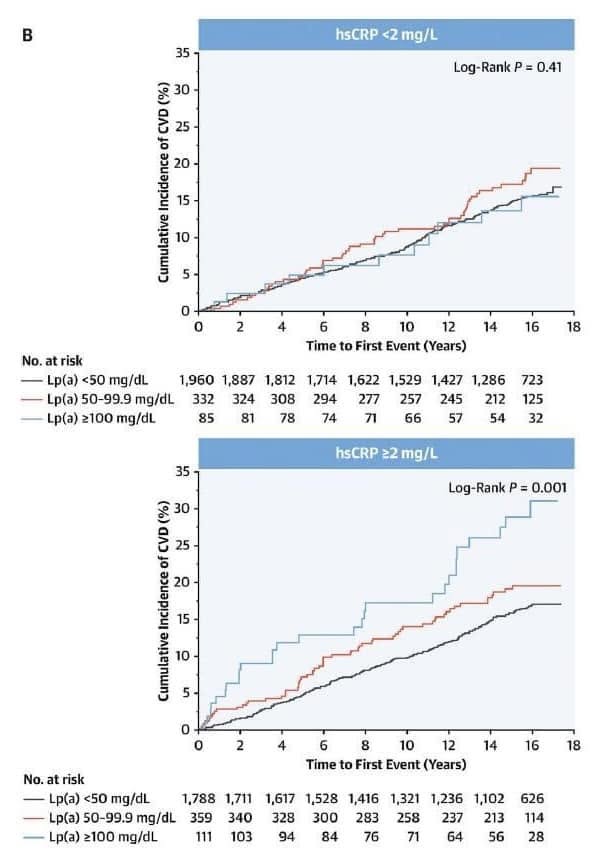
Where risk begins is debated. A Mass General Brigham registry analysis suggested risk was already elevated from the 51st percentile (42-111 nmol/L, adjusted HR 1.14), above the median and well below the 125 nmol/L guideline cutoff (the 80th percentile)40. In the Women's Health Study, the top versus bottom fifth of Lp(a) had a hazard ratio of 1.33 for 30-year events41. In MESA, however, high Lp(a) raised risk only when hsCRP was 2 mg/L or higher (HR 1.36 for Lp(a) 50-99.9 mg/dL and 2.09 for 100 or more), in lower-risk people averaging age 6242. Louis's follow-up reading is that a CAC score under 100, hsCRP under 2 mg/L and low visceral fat seemed protective in MESA, though it is an observational cohort that cannot prove causality43.
Show data
| Adjusted hazard ratio | 95% CI | |
|---|---|---|
| 51st–70th percentile (42–111 nmol/L) | 1.14 | 1.05–1.24 |
| 71st–90th percentile (112–215 nmol/L) | 1.21 | – |
What to do about it: Louis shared Sam Tsimikas's reaction to the Lp(a)HORIZON trial of an Lp(a)-lowering drug, which Louis's post describes as having failed. Tsimikas does not see it as a failure. He suggests Lp(a) risk may instead be reduced by keeping LDL-C at or below 65, blood pressure at or below 120, other risk factors controlled and proven medicines taken, and describes treating his clinic patients with statins, ezetimibe and PCSK9 inhibitors44. A UK Biobank genetic analysis found the roughly 37% higher coronary risk from lifelong high Lp(a) was offset by lifetime LDL-C about 19 mg/dL lower, with larger reductions needed the later treatment starts45.
Blood pressure
Gokhan shares Dr. Brad Stanfield's explanation that systolic pressure under 120 mmHg is now seen as ideal, while drug treatment targets are under 130, since some people do not feel well at 12010. The same source cites SPRINT and a Chinese follow-up showing that targeting under 120 rather than 140 reduced heart attacks, strokes and death, with 25-27% lower mortality, while stressing individualized treatment in older adults to avoid dizziness and fainting46. A SPRINT follow-up estimated residual survival from age 50 at 37.3 versus 34.4 years (a 2.9-year difference), with fewer white matter lesions on the intensive arm; SPRINT enrolled people 50 or older with hypertension, without diabetes or prior stroke5. The video summaries also tie high pressure to dementia and recommend home monitoring, salt under 1,500 mg a day, a DASH diet, a potassium-rich diet, exercise, sleep and weight control, with medication when needed4647.
Hibiscus tea has small trial support for lowering pressure; Gokhan summarizes a 17-trial analysis showing a 7.1 mmHg drop in systolic pressure, though that is his blog's summary rather than a guideline48. Gokhan also reports, as an anecdote, a systolic reading of 107 after starting potassium10.
Blood sugar and insulin resistance
Carvalho's targets, as summarized by Gokhan, are HOMA-IR ideally under 1.0 (over 2.0 indicates insulin resistance and over 3.0 frank resistance) and HbA1c under 5.7%, noting even a rise from 5.1 to 5.5 is a red flag2. HOMA-IR is calculated from fasting glucose and fasting insulin2. Gokhan's own list of tracked targets includes BMI under 30, systolic pressure under 120, LDL under 70 and fasting glucose under 90 mg/dL, set with his physicians because of a chronic blood disorder, so these are personal rather than general49.
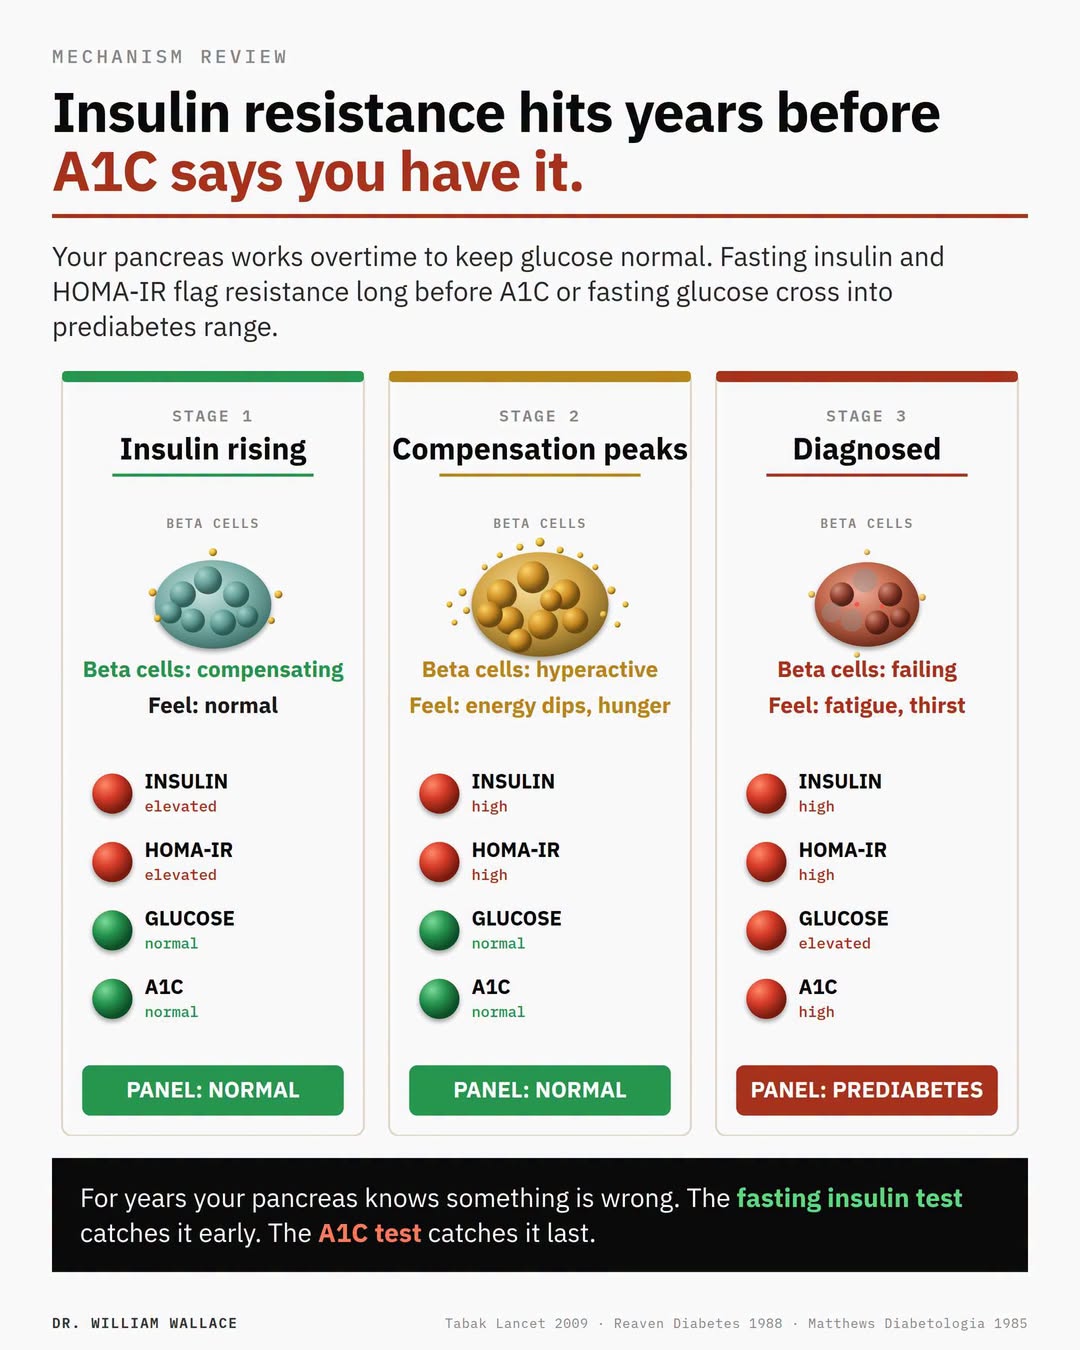
Why look beyond glucose and HbA1c? In the Whitehall II analysis Louis shared, people who developed type 2 diabetes had about 34% lower HOMA insulin sensitivity across the whole 13-year window, while glucose and A1C stayed in the normal range for years. The suggested earliest tests are fasting insulin and a 2-hour oral glucose tolerance test (OGTT) with insulin at 30, 60, 90 and 120 minutes6. Gokhan's lab list likewise includes fasting glucose, HbA1c, insulin and HOMA-IR1. Louis adds that an OGTT is the definitive test of whether diabetes has truly resolved, since a low A1C on a low-carb diet does not prove it50. He argues liver fat is the driver of insulin resistance and that continuous glucose monitors can mislead, citing his own A1C of 4.7 with liver fat under 1%, which is his position rather than a trial result51.
Food can move these numbers. A meta-analysis of 102 feeding trials found polyunsaturated fat improved fasting glucose, HbA1c and HOMA-IR, monounsaturated fat did somewhat less, and saturated fat showed no appreciable benefit52. Psyllium lowered LDL by 13 mg/dL and ApoB by 5 mg/dL across 28 trials, and lowered HbA1c by 0.97% and fasting glucose by 37 mg/dL in people with type 2 diabetes, with little effect if blood sugar is normal53. A 74-trial analysis found oats lowered LDL-C by 0.29 mmol/L and fasting glucose by 0.25 mmol/L, although ApoB did not change significantly (only two studies)54. Taurine had modest effects in a meta-analysis (fasting glucose down 5.9 mg/dL, LDL down 6.5 mg/dL)55, and a 120-person trial found it lowered insulin and HOMA-IR in type 2 diabetes without changing HbA1c or lipids56.
Inflammation and imaging
hs-CRP predicts events independently of cholesterol, according to Gokhan's baseline lab list1. In the Women's Health Study, the top versus bottom fifth had a hazard ratio of 1.70 for hs-CRP, 1.36 for LDL and 1.33 for Lp(a), each independent, with the combination predicting best41. Gokhan's list also offers a CAC score or carotid ultrasound as the imaging option1. One keto practitioner's account shows why markers need watching on any diet: 15 years of keto lowered blood pressure, triglycerides, HbA1c, insulin and hsCRP but raised LDL and ApoB until ezetimibe was added57.
Show data
| Hazard ratio | 95% CI | |
|---|---|---|
| hs-CRP | 1.70 | – |
| LDL cholesterol | 1.36 | – |
| Lp(a) | 1.33 | – |
Reading numbers carefully
Observational U-shaped curves, where both low and high values look worse, appear for cholesterol, BMI, A1C and blood pressure alike. Louis explains these as reverse causality (illness itself lowers LDL, BMI, A1C or pressure), and notes randomized trials and Mendelian randomization show lower LDL causes lower risk5859. Lipid risk also depends on context: Louis says age matters most and many other risk factors remain after LDL is treated38.
What this means for you
- A reasonable starting panel, per Gokhan: lipid panel, ApoB, Lp(a), hs-CRP, fasting glucose, HbA1c, insulin and HOMA-IR, with an imaging test, tracked over time in a spreadsheet1.
- The group's admins recommend discussing LDL and ApoB goals with your doctor, using the risk-tiered targets above rather than a single number83234.
- Test Lp(a) once; if it is high, the emphasis is on lowering LDL and controlling blood pressure and other risk factors844.
- Home blood pressure monitoring is the first step in the video summaries the group shared46.
- Skip tests with little added value, such as particle size and oxidized LDL, unless your doctor has a specific reason2428.
Frequently asked questions
Is ApoB better than LDL-C?
Per the posts, ApoB is more accurate when the two diverge, but the consensus does not require it for everyone1416.
What should my Lp(a) be?
Carvalho's summary says generally under 75 nmol/L2. The guideline flags 125 nmol/L or higher8, though one registry analysis suggested risk begins lower40.
Do I need to worry about my triglycerides?
Triglycerides below 400 mg/dL are already reflected in ApoB, and drug-lowering them alone did not shrink plaque2122.
Is an HbA1c in the normal range enough?
Not necessarily. HbA1c under 5.7% is the quoted target, but insulin resistance can precede abnormal HbA1c by years26.
Should I get my LDL as low as possible?
The group's view is that targets scale with risk: very low values are advised for high-risk people, not low-risk ones34.