Medical headlines usually quote the most impressive version of a result, often a relative figure such as "50% lower risk." That number is accurate as a ratio, but it does not tell you how likely the event was in the first place. Absolute risk is the plain probability of an event, and the absolute risk reduction is the difference in that probability between two groups. Both views are needed to judge a result.
The group's admins, especially Louis Nervegna, have returned to this topic many times, mostly in discussions of statin trials. His central argument is that small absolute numbers in short trials are often dismissed unfairly, because the baseline risk in a few years is small to begin with.12 This article explains the key terms, works through examples from posts in the group, and covers the other things worth checking when reading a trial: endpoints, subgroups, event counts and noninferiority claims. It is a summary of group discussion, not medical advice.
The basic vocabulary
- Absolute risk is the chance of an event in a given time, for example a 3% chance of a heart attack over a few years.
- Relative risk reduction (RRR) is the proportional change versus a comparison group, for example 33% lower. Louis's example is that a drop from 3% to 2% is a 1% absolute reduction and a 33% relative reduction, and both describe the same result.13
- Hazard ratio (HR) is a relative measure of how fast events occur in one group compared with another; an HR of 0.70 corresponds to 30% lower risk.5
- Number needed to treat (NNT) is the average number of people who need to be treated to prevent one additional bad outcome. It is the inverse of the absolute risk reduction: NNT = 1 / ARR. A 1% absolute reduction gives an NNT of 100; a 10% reduction gives an NNT of 10.3
Louis points out an important feature of NNT: it applies to diet and exercise as much as to drugs.3 He adds that the absolute risk reductions from diet and exercise in short prevention trials are in the same ballpark as those from statins, so their NNTs are too.3
A worked example with LDL
Louis offers a rule of thumb extracted from dozens of randomized trials: each drop of roughly 40 mg/dL in LDL lowers the relative risk of heart attack and stroke by about 20%.7 To personalize it, apply it to your own absolute risk. If your 10-year risk is 20%, a 40 mg/dL drop gives 16%, which is a 20% relative decline and a 4-point absolute one.7 The same relative reduction would translate to a much smaller absolute change for someone whose 10-year risk starts at 3%.
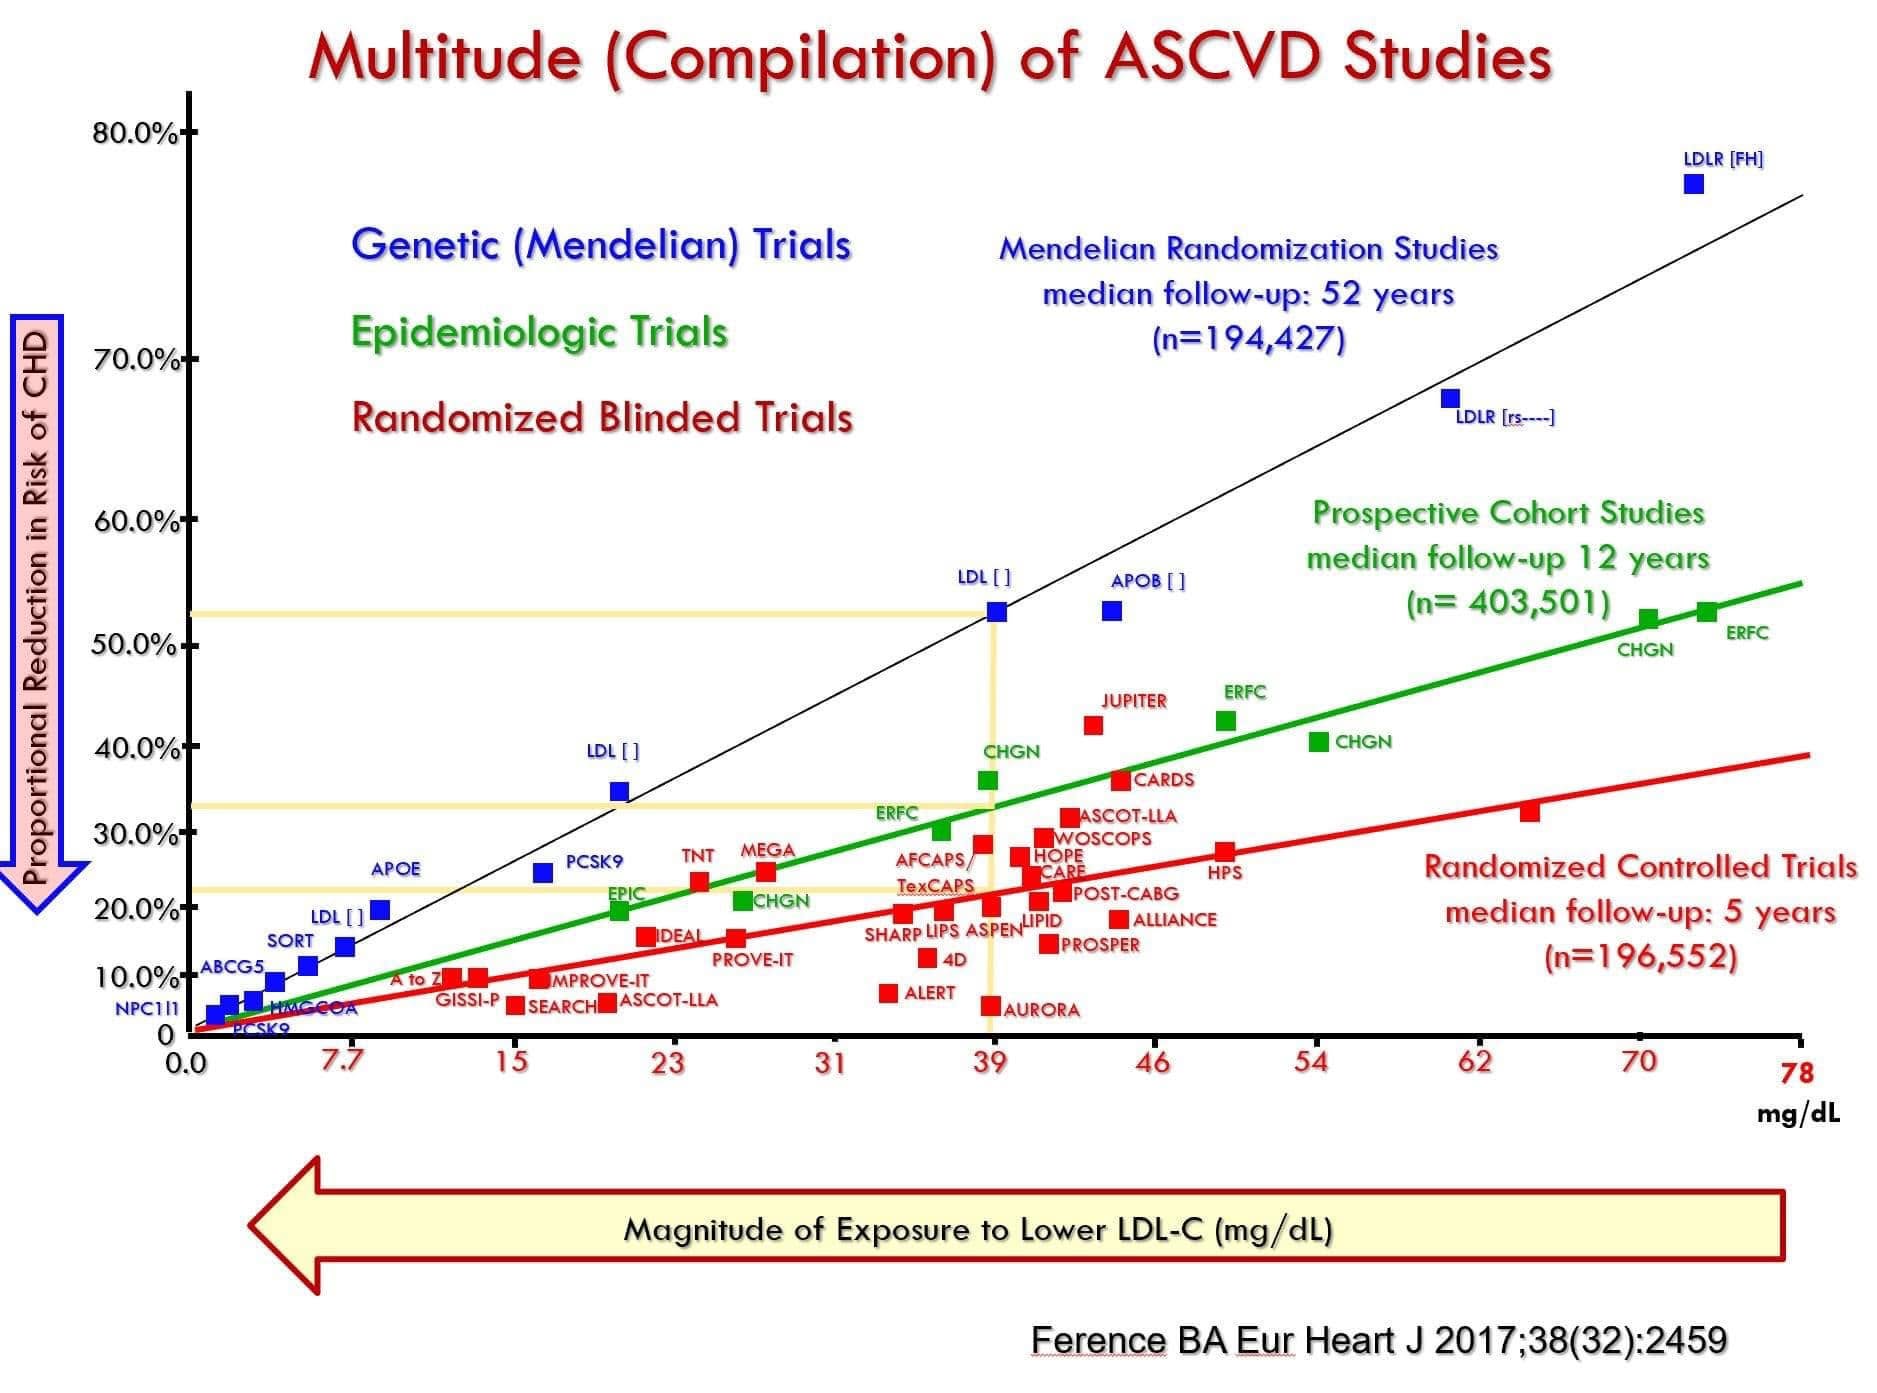
A review summarized by Gokhan Can reports a similar figure: 21% relative risk reduction per 38.7 mg/dL (1 mmol/L) drop, with benefit extending down to levels as low as 21 mg/dL.8 A graph of 25 statin RCTs that Louis shared shows about 40% lower major adverse cardiac events per roughly 75 mg/dL LDL reduction.9
Why baseline risk changes everything
The same relative effect produces different absolute gains depending on who is treated. Gokhan quoted a physician's summary of an analysis in people aged 80 or older: statin users had a 31% lower relative risk of dying, and the absolute risk was reported as 17% lower. The principle stated is that absolute benefit hinges on the control group's risk, so it looks small in younger people over the short term but grows with time, age or illness.10
Related examples from the group:
- Louis notes that people who already had a heart attack or stroke are "closer to the edge," so the same LDL drop protects them more in absolute terms, which is why secondary-prevention goals are often under 55 mg/dL and sometimes under 40.7
- A JACC analysis on lipoprotein(a), shared by Louis, found that elevated Lp(a) raises relative risk across coronary calcium (CAC) strata, but among people with a CAC score of zero absolute event rates stay low even when Lp(a) is high.11
- A systematic review of 17 trials of saturated fat reduction found little or no benefit over 5 years in low-risk people, while in high-risk people there were possibly important reductions, particularly for nonfatal heart attack when saturated fat was replaced with polyunsaturated fat (RR 0.75, CI 0.58 to 0.99).12 The authors framed this using absolute thresholds per 1,000 people, which is itself a lesson in reading results.12
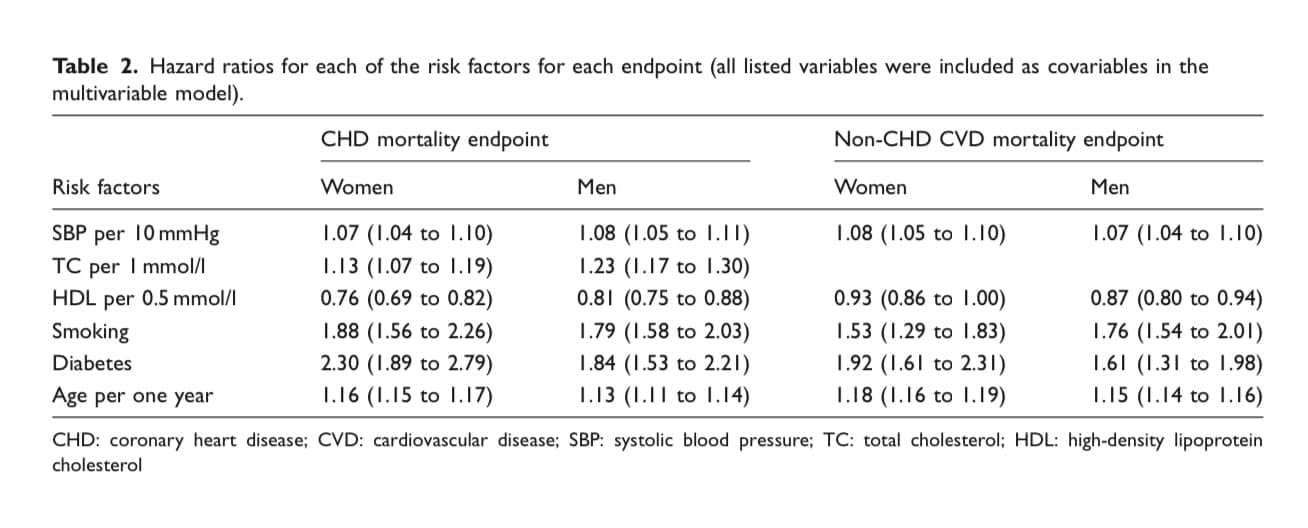
Relative numbers can also be misread when they compound. In a risk-model table Louis discusses, each additional year of age above 65 carries a hazard ratio of 1.16, so 20 years multiplies the risk by about 19.5 times. The post itself writes this as "19,500%", which is a mislabel of 19.5-fold.13 Percentages above 100% are easy to garble; thinking in "times" is clearer.
Time horizon: short trials versus a lifetime
The most distinctive argument in the group concerns time. Statin trials run for about 5 years, a period in which the absolute risk of a heart attack or stroke is only around 2-5% even in higher-risk people.14 Louis's reasoning follows:
- Reducing absolute risk by 1-2% in that window is therefore excellent, because it is a large share of the risk that was there to prevent.14
- You cannot reduce absolute risk below zero, so even a complete cure for heart disease would show only a 2-5% absolute reduction in a trial lasting a few years.14
- Diet and lifestyle trials show 1-2% reductions over the same period, so the criticism applies equally to everything.114
- Over a lifetime the average American's heart attack risk is about 20% (1 in 5), so benefits can accumulate to much larger absolute numbers.14
He sums up that the absolute benefit of statins is cumulative: a few percent in the first years, but potentially 10% or more across a lifetime.14 In an earlier post he reported absolute reductions of 1.1% to 4.7% in roughly 5-year RCTs and calculated that this would take a 20% lifetime risk down to 15.3-18.9% from five years alone, and toward 10% if continued for decades.215 That calculation is his own framing, and the toward-10% figure is an extrapolation rather than a trial result.2
Where the lifetime numbers come from
Because RCTs do not run for decades, Louis combines three kinds of evidence in a graph: for a 39 mg/dL LDL reduction, risk of heart attack was over 20% lower at 5 years (RCTs), over 30% lower at 12 years (prospective cohorts) and over 50% lower at 52 years (Mendelian randomization, studies using genetic variants that lower LDL for life).1617 Translating the 50% figure to a 20% lifetime risk gives about 10%.16 He is explicit that a low-dose statin will not prevent every heart attack; at best it could roughly halve lifetime risk if taken for decades, and the remainder needs diet, lifestyle and other therapies.17
Other examples of the same arithmetic:
- Louis states that Mendelian randomization suggests lowering LDL by about 80 mg/dL for around 52 years corresponds to an 80% relative risk reduction, which would take a 20% lifetime risk to 4% (100% minus 0.8 x 20%).18
- On a chart of genetic variants, a 90% relative lifetime risk reduction from PCSK9 variants corresponds to 18 points lower out of 20%, leaving about 2%.19
- A meta-analysis cited by Gokhan found that the relative reduction in major vascular events per 1 mmol/L LDL lowered grows with treatment duration: 12% at year 1, 20% at year 3, 23% at year 5 and 29% at year 7.20
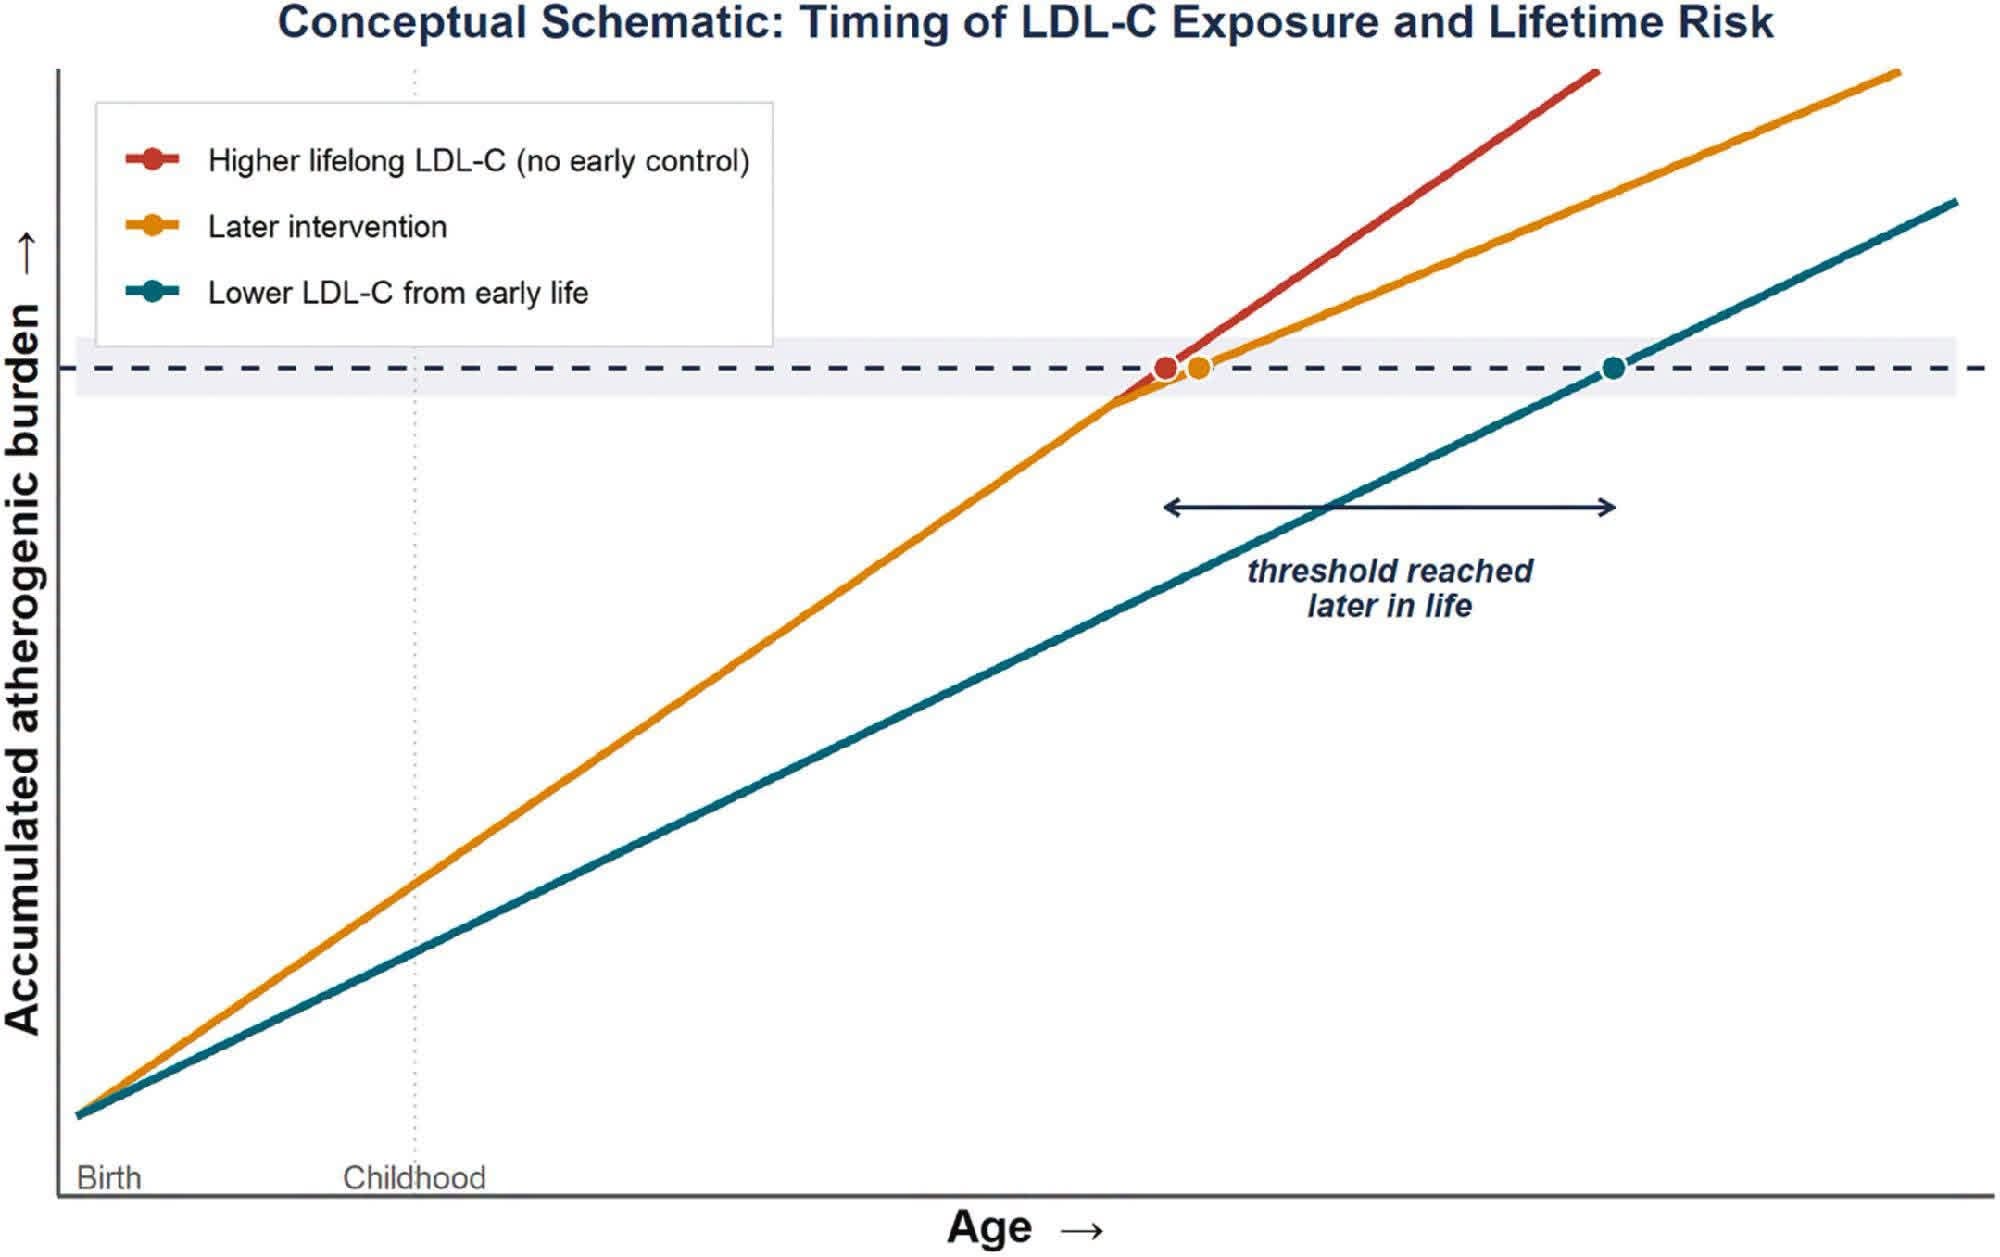
- Louis also explains that LDL lowering does not cure disease but delays crossing the threshold for a heart attack or stroke, and that starting earlier gives a larger lifelong benefit.21
A counterweight: benefit in "days of life"
Louis also shows how absolute numbers can look small from another angle. Only about 10% of heart attacks and strokes are fatal, and only 1 in 5 US deaths come from them, so the reduction in overall deaths is about 50 times smaller than the reduction in heart attacks and strokes. His back-of-envelope result is a 0.022% to 0.094% reduction in overall deaths over 5 years, roughly 10-20 days of added lifespan on average.22 It is a population-averaged calculation, but it shows that the answer to "is it a big benefit?" depends on which outcome and which time frame is being counted.22
Reading benefit and harm in absolute terms
Absolute numbers are just as useful for side effects.
- Statins and diabetes. In roughly 5-year RCTs, statins raise the relative risk of new type 2 diabetes by about 9-12% (20-36% at very high intensity). Louis says he stated this "in the scariest way possible" on purpose: for someone whose 5-year diabetes risk is 1 in 1,000, it becomes about 1.12 in 1,000. The same treatment prevents about 11 major cardiovascular events per 1,000 patients, against about 1 extra diabetes case.6 The effect is concentrated in people already near the diabetes threshold, whose diagnosis may simply come sooner.6
- A review shared by Gokhan puts the number needed to harm at approximately 255 patients treated for four years per excess case of diabetes, versus about 5-9 major cardiovascular events prevented.23
- Icosapent ethyl (REDUCE-IT). A 25% relative reduction in major cardiovascular events came with higher rates of hospitalized atrial fibrillation or flutter (5.3% vs 3.9%) and bleeding (11.8% vs 9.9%).24
- Aspirin in a genetic subgroup of ASPREE. Among people in the top fifth of a platelet-count genetic score, dementia occurred in 1% on aspirin versus 3.3% on placebo (about 70% relative reduction), but major bleeding was 4.4% versus 2.1%. The authors call it hypothesis-generating.25
Comparing absolute benefit with absolute harm is usually more informative than comparing two relative figures.
Show data
| Treatment | Placebo | |
|---|---|---|
| REDUCE-IT (icosapent ethyl): hospitalized atrial fibrillation or flutter | 5.3% | 3.9% |
| REDUCE-IT: bleeding | 11.8% | 9.9% |
| ASPREE subgroup (aspirin): dementia | 1% | 3.3% |
| ASPREE subgroup: major bleeding | 4.4% | 2.1% |
NNT in real trials
- STAREE (atorvastatin 40 mg versus placebo in 9,971 adults averaging about 75, median 5.9 years): major cardiovascular events fell 30% (HR 0.70, CI 0.61 to 0.82), with an NNT of 37 over about 6 years. The summary describes that as a favorable number for primary prevention.5
- DO-HEALTH (2,157 adults aged 70+): the combination of vitamin D3, omega-3 and home exercise was associated with 4 invasive cancers versus 12 on placebo, a 61% reduction with an NNT of 35.26
- SURPASS-CVOT (13,299 adults with type 2 diabetes and heart disease): on a broader six-point cardiorenal outcome the summary reports a 3.7% absolute reduction, NNT 27.27
These examples show that an NNT is tied to a specific population, outcome and follow-up length. An NNT of 37 over six years is not comparable with an NNT for a different outcome, in different people or over a different length of time.
Small numbers, big percentages
When few events occur, relative figures can swing wildly.
- In the EVITA trial of vitamin C in pre-cancerous blood conditions, there were 11 deaths versus 24 (a 65% lower risk of death), but survival was an exploratory outcome and the primary endpoint (clonal growth) showed no significant difference. Louis calls speculation about heart disease a "big unproven leap."28
- In DO-HEALTH, the 61% reduction rests on 4 versus 12 cancers.26
- In the Lyon Diet Heart Study, the counts were 16 cardiac deaths in the control group versus 3 on the Mediterranean diet and 17 versus 5 nonfatal heart attacks (risk ratio 0.27 for the combined endpoint), which Louis describes as 73% fewer events.29
- In Q-SYMBIO (420 heart failure patients), major cardiovascular events occurred in 15% on CoQ10 versus 26% on placebo (HR 0.50); another post describes the findings as promising but not definitive because the trial was modest in size.30
Giving counts alongside percentages helps you judge how much weight a result can bear.
Show data
| Treatment | Control | |
|---|---|---|
| EVITA (vitamin C): deaths | 11 | 24 |
| DO-HEALTH (vitamin D3, omega-3, exercise): invasive cancers | 4 | 12 |
| Lyon Diet Heart Study (Mediterranean diet): cardiac deaths | 3 | 16 |
| Lyon Diet Heart Study: nonfatal heart attacks | 5 | 17 |
Endpoints: what exactly was measured?
Primary versus secondary endpoints
A trial is designed to answer a primary question. Anything else is a secondary or exploratory result that may be due to chance.
- In COSMOS (21,442 older adults taking cocoa extract), CVD mortality was 27% lower (HR about 0.73) over 3.6 years, but this was a secondary outcome and the primary endpoint of total cardiovascular events was not significantly reduced.31
- Louis says large vitamin D trials missed their primary endpoints, with some benefits in secondary endpoints, subgroups and post hoc analyses, so "betting your life on vitamin D is a big mistake."32
- In STAREE, the 30% reduction in major events sat beside no significant difference in overall mortality and no meaningful improvement in disability-free survival, which was one of the two primary outcomes; there was no increase in dementia.5
- The TOGETHER metformin trial was retracted in October 2025 because an analysis error led to early stopping; Louis notes two other trials were not affected.33
Hard endpoints versus markers
Louis stresses that the saturated-fat trials he cites looked at hard endpoints such as deaths, heart attacks and strokes, not just cholesterol.12 A change in a marker does not guarantee a change in outcomes:
- In Lp(a)HORIZON (8,322 patients with prior cardiovascular disease), pelacarsen lowered Lp(a) by 78.4% versus 3.2% on placebo, yet the primary endpoint occurred in 12.3% versus 12.1%. Senior author Steven Nissen cautioned that a single neutral trial does not prove lack of benefit.34 A summary from an Ionis executive notes participants were already aggressively treated, and that the evidence linking Lp(a) to events came mostly from general populations.35
Show data
| Pelacarsen | Placebo | |
|---|---|---|
| Reduction in Lp(a) from baseline | 78.4% | 3.2% |
| Primary endpoint (cardiovascular events) | 12.3% | 12.1% |
- In a vitamin K2 and coronary calcium review, a 14-trial meta-analysis found a small difference in calcium progression (-17.3 Agatston units per year), but event data came from a trial not powered for hard endpoints, and the post concludes it is not yet a standard therapy.36
Composite, all-cause and cause-specific outcomes
MACE (major adverse cardiovascular events) combines several events, and each component should be checked.2734 Another post shows why the choice of outcome matters: a 91% lower relative hazard of death from any cause with GLP-1 drugs in women with breast cancer and diabetes came from an observational study, and Louis stresses that it did not show fewer breast-cancer deaths or prove causation.37
Noninferiority: "not worse" is not "the same"
Two recent posts show how to read noninferiority results.
- SURPASS-CVOT. Tirzepatide versus dulaglutide: MACE in 12.2% versus 13.1% (HR 0.92, 95.3% CI 0.83 to 1.01). Noninferiority was met (P=0.003), superiority was not (P=0.09). The shared summary says matching a drug with proven heart benefit implies benefit over placebo, but that is an indirect inference.27
- STREAM. In 1,880 adults aged 70+ without known cardiovascular disease, those who stopped statins had events in 12.7% versus 9.2% (about 38% more in relative terms), yet the trial concluded stopping was noninferior. The commentary Louis shared explains that noninferiority means the difference fell within a preset margin, not that outcomes were identical. The safety board advised discussing restarting, and the commentator says stopping can be appropriate for frailty or side effects but not simply because of age.38
Show data
| Hazard ratio (log scale) | 95% CI | |
|---|---|---|
| STAREE: atorvastatin vs placebo, adults about 75 | 0.70 | 0.61–0.82 |
| SURPASS-CVOT: tirzepatide vs dulaglutide | 0.92 | 0.83–1.01 |
A confidence interval that includes 1.0 (for ratios) means a result is not statistically significant. In the saturated fat review, for instance, the pooled RR for all-cause mortality was 0.96 (0.88 to 1.06).12
Relative numbers from observational studies
Large relative figures are also common in observational research, where they carry both the problem of missing absolute context and the problem of confounding. Examples shared in the group include 44% higher dementia risk with processed meat in a review of observational studies39, 43% lower type 2 diabetes risk for the top versus bottom fifth of omega-6 biomarker levels40, and hazard ratios of 1.70, 1.36 and 1.33 for hs-CRP, LDL and Lp(a) in the Women's Health Study over 30 years.41 Louis also works out an illustration for Lp(a): a hazard ratio of 1.16 per 50 mg/dL means 250 mg/dL implies about an 80% higher risk, taking a 20% lifetime risk to about 36%, a linear extrapolation that he describes as his own.42 A wine analysis of PREDIMED reported a hazard ratio of 0.5, which Louis called possible but unproven.43
What this means for you
- Ask for both numbers: the relative change and the absolute risk before and after.17
- Work out the baseline risk for the time period of the study. A 1% reduction on a 3% baseline is a one-third relative reduction.1
- Check how long the trial ran. Short trials show small absolute reductions for almost any intervention.414
- Look at NNT with its time frame, population and outcome.527
- Compare absolute benefit with absolute harm, as in the statin-diabetes example.623
- Check whether the headline came from a primary endpoint or a secondary, subgroup or exploratory analysis.283132
- Check whether the endpoint is a hard outcome or a marker.3436
- Read "noninferior" as "within a preset margin," and look at the actual event rates.2738
- For personal decisions, the admins recommend discussing your own absolute risk and goals with your doctor.7
Frequently asked questions
Is a 1% absolute risk reduction too small to matter?
It depends on the baseline and the time frame. Louis argues that over a few years the absolute risk of heart attack is only 2-5%, so a 1-2% reduction is a large share of what could be prevented, and the benefit accumulates over longer periods.414 The counter-view in the discussions he responds to is that such numbers are small; his reply is that the number needs context.1
How do I convert a relative risk reduction into an absolute one?
Multiply the relative reduction by your baseline risk. A 20% relative reduction on a 20% 10-year risk lowers it to 16%.7 Louis uses the same arithmetic for lifetime estimates, for example 0.9 x 20% = 18 points.19
What is a good NNT?
There is no universal threshold in the posts. Louis argues that NNTs from short prevention trials will look high for any intervention because baseline risk is low, and that a lifetime NNT could be about 10.3 The STAREE summary calls 37 over about 6 years favorable for primary prevention.5
Why do some trials show impressive percentages but no change in overall survival?
Because the outcomes measured differ. In STAREE major events fell 30% but overall mortality did not differ significantly.5 Louis's arithmetic on fatal events also shows why overall deaths change much less than heart attacks and strokes over five years.22
Does a neutral trial prove a treatment does not work?
Not necessarily. After Lp(a)HORIZON, Nissen said a single neutral trial does not definitively show that lowering Lp(a) lacks benefit, and ongoing trials study other populations.34